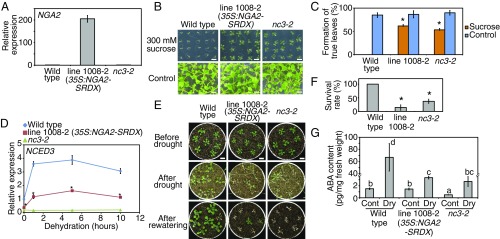
Fig. 1.
The 35S:NGA2-SRDX plants (line 1008-2) revealed decreased expression of NCED3 and were sensitive to drought stress. (A) Expression levels of NGA2 in the identified line through a screen. The error bars indicate the SD from triplicate technical repeats. (B and C) Sucrose insensitivity of the 35S:NGA2-SRDX plants in germination. (B) Images of plants grown on MS medium with or without 300 mM sucrose for 2 wk. (Scale bars: 1 cm.) (C) Rates of plants forming true leaves grown on medium with or without 300 mM sucrose. The error bars indicate the SD from four replicates (n = 20 each). Asterisks indicate significant differences from the wild-type plants. *P < 0.01 (Bonferroni-corrected Student’s t test). (D) Expression levels of NCED3 in the identified line through a screen. Plants grown on MS medium for 2 wk were treated with dehydration stress. The error bars indicate the SD from triplicate technical repeats. Asterisks indicate significant differences between the 35S:NGA2-SRDX and wild-type plants. *P < 0.01 (Bonferroni-corrected Student’s t test). (E and F) Drought-stress tolerance test of the 35S:NGA2-SRDX and nc3-2 mutant plants. (E) Images of plants before and after drought and after rewatering. Plants grown on MS medium for 2 wk were transferred to soil and grown for 2 d. Water was withheld for 11 d. (Scale bars: 1 cm.) (F) Survival rates of plants after rewatering. The error bars indicate the SD from five replicates (n = 35 total). Asterisks indicate significant differences from the wild-type plants. *P < 0.01 (Bonferroni-corrected Student’s t test). (G) ABA contents of the 35S:NGA2-SRDX and nc3-2 mutant plants during nonstress (Cont) and dehydration stress (Dry). Plants grown on MS medium for 2 wk were treated with dehydration stress for 4 h. The error bars indicate the SD from six replicate samples. The letters above the bars indicate significant differences among plant lines under nonstress and dehydration-stress conditions (P < 0.05, according to Tukey’s multiple range test).

