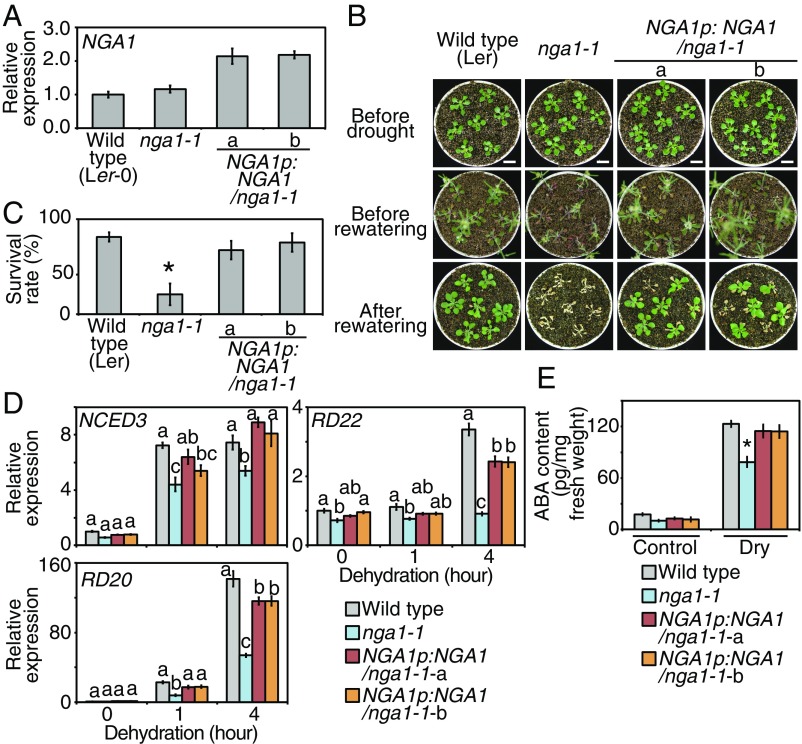
Fig. 5.
The nga1-1 single mutants revealed decreased expression of NCED and were sensitive to drought stress. (A) Expression levels of NGA1 in nga1-1 and complemented lines. The error bars indicate the SD from triplicate technical repeats. (B and C) Drought-stress tolerance test of nga1-1 and complemented lines. (B) Images of plants before and after drought and after rewatering. Plants grown on MS medium for 2 wk were transferred to soil and grown for 2 d. Water was withheld for 15 d. (Scale bars: 1 cm.) (C) Survival rates of plants after rewatering. The error bars indicate the SD from five replicates (n = 35 in total). Asterisk indicates significant differences from the wild-type plants. *P < 0.01 (Bonferroni-corrected Student’s t test). (D) Expression levels of NCED3 and other dehydration-inducible genes during dehydration stress in nga1-1 and complemented lines. Plants grown on MS medium for 2 wk were treated with dehydration stress. The error bars indicate the SD from triplicate technical repeats. The letters above the bars indicate significant differences between the plant lines at each time point (P < 0.05, according to Tukey’s multiple range test). (E) ABA contents of nga1-1 and complemented lines during nonstress (Control) and dehydration stress (Dry). Plants grown on MS medium for 2 wk were treated with dehydration stress for 3 h. The error bars indicate the SD from at least four replicate samples. Asterisk indicates significant differences from the wild-type plants. *P < 0.01 (Bonferroni-corrected Student’s t test).

