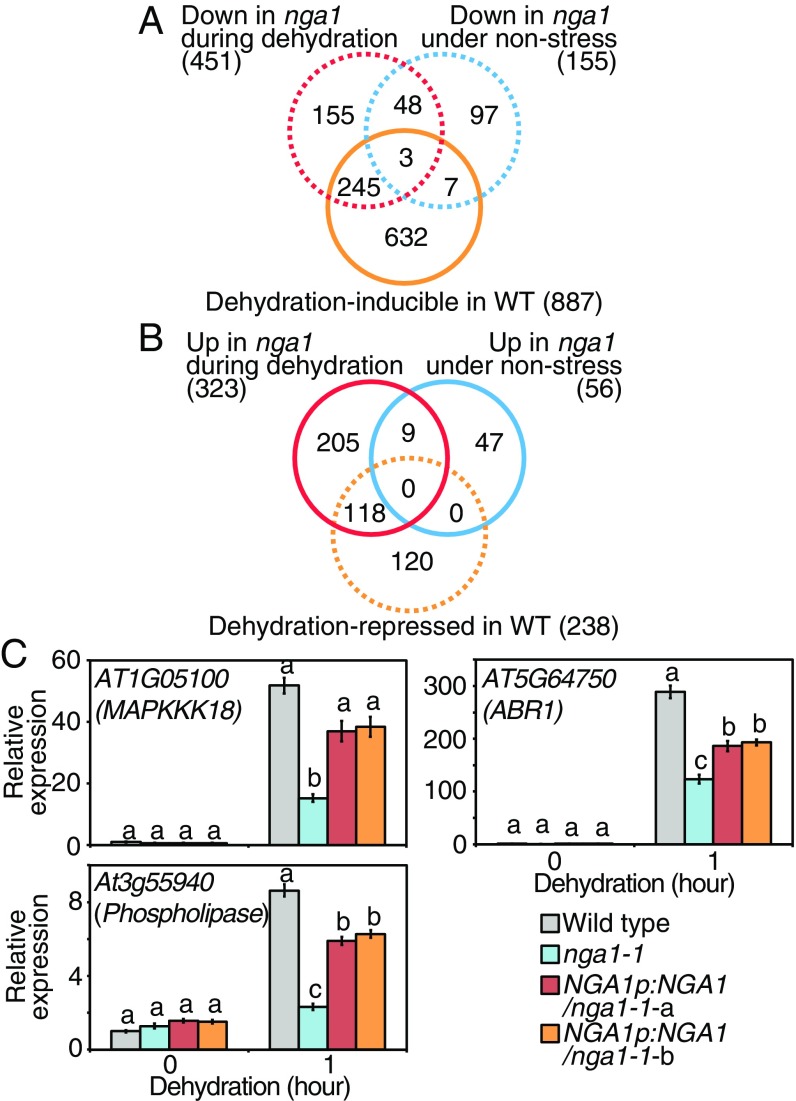
Fig. 6.
Transcriptome analysis revealed the essential roles of NGA1 during dehydration stress. (A) Venn diagram comparing the dehydration-inducible genes in the wild-type plants and down-regulated genes in nga1-1 under nonstress and dehydration-stress conditions. The total numbers of each set of genes are presented in parentheses. (B) Venn diagram comparing the dehydration-stress-repressed genes in the wild-type plants and up-regulated genes in nga1-1 under nonstress and dehydration-stress conditions. The total numbers of each set of genes are given in parentheses. (C) Expression levels of the dehydration-inducible genes identified by RNA-seq in nga1-1 and complemented lines during dehydration stress. The error bars indicate the SD from triplicate technical repeats. The letters above the bars indicate significant differences between the plant lines at each time point (P < 0.05, according to Tukey’s multiple range test).

