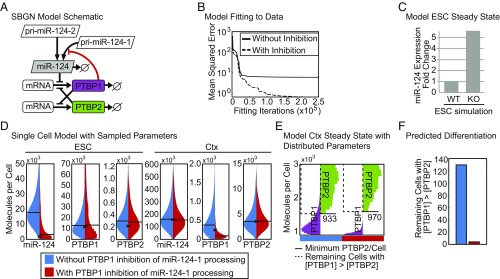
Fig. 6.
PTBP1 inhibition of miR-124-1 maturation mitigates cell-to-cell variability during neuronal differentiation. (A) Schematic of the ordinary differential equation model of miR-124 expression presented in Systems Biology Graphical Notation [SBGN (89)]. Known regulatory interactions are indicated with black lines and the inhibition of miR-124 processing by PTBP1 identified here is indicated by a red line. (B) Mean squared error between best simulation fits and the molecule numbers measured experimentally (Table 1). Parameter estimation was performed by particle swarm optimization in either the model with the inhibition of pri-miR-124-1 processing by PTBP1 (dashed line) or without the addition of this mechanism (solid line). (C) Prediction of miR-124 levels in the WT and PTBP1 KO ESC from simulations maintaining or removing the synthesis of PTBP1. (D) Distribution of mature miR-124, PTBP1, and PTBP2 levels in ESCs and cortical neurons (Ctx) in 1,000 single-cell simulations run with (red) and without (blue) PTBP1 inhibition of pri-miR-124-1 processing. The experimentally measured value is indicated with an x and the median molecule numbers are indicated with horizontal lines. (E) PTBP1 and PTBP2 molecules in 1,000 simulated single cells of the Ctx stage at the end of the modeled time course, with (red bar) and without (blue bar) PTBP1 inhibition of pri-miR-124-1 processing (shown in SI Appendix, Fig. S9). The minimum PTBP2 molecule number is indicated with a solid line and those cells with more PTBP1 than this number are indicated in the region marked with a dashed line. (F) Number of cells from 1,000 single-cell simulations in which the concentration of PTBP1 in the neuronal population was above the minimum PTBP2 concentration at this stage with (red) and without (blue) PTBP1 inhibition of pri-miR-124-1 processing (number of cells within the region marked with a dashed line in E).

