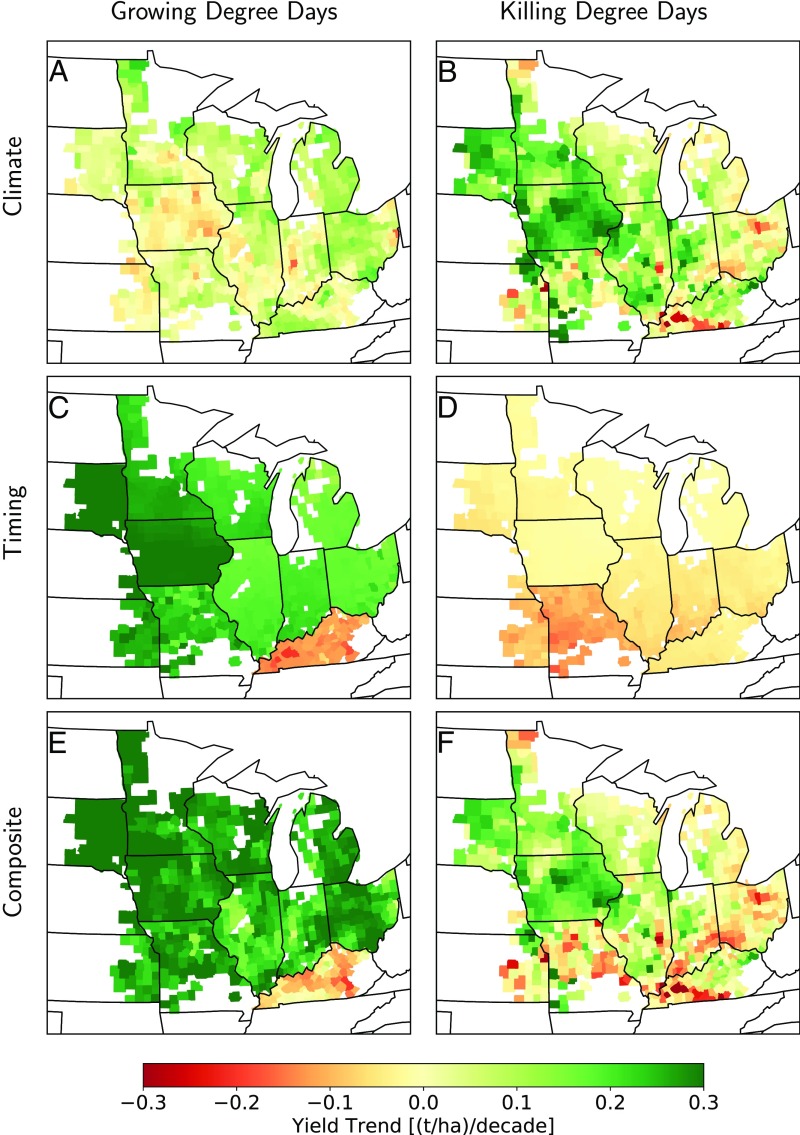
Fig. 2.
Spatial components of the yield trend. (A–D) Yield trends are broken into those attributable to climate from GDDs (A) and KDDs (B) and those attributable to timing from GDDs (C) and KDDs (D). (E and F) The combined influence on yield trends from GDDs (E) and KDDs (F) is also shown. Trends are in tonnes per hectare per decade and are computed between 1981 and 2017.

