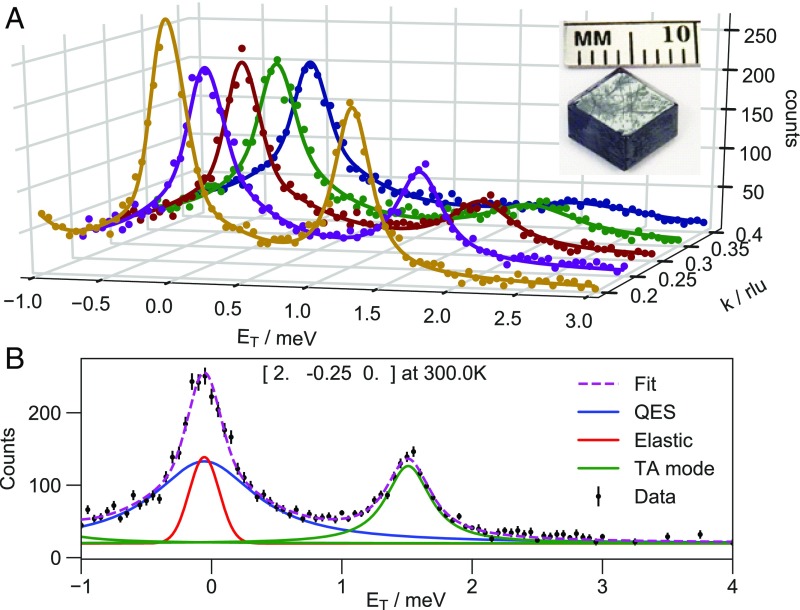
Fig. 1.
Constant-Q scans and fits. (A) Constant-Q scans and their fits measured along the [2, −k, 0] direction. As k increases, the TA phonon energy increases and the linewidth broadens. The curves are colored yellow (k = 0.2), purple (0.25), red (0.3), green (0.35), and blue (0.4). (Inset) Fully deuterated d6-MAPI single crystal weighing 420 mg. (B) Constant-Q scan at [2, −0.25, 0] (purple curve in A) with fit and components shown. Reprinted with permission from ref. 30, which is licensed under CC BY-NC 3.0.

