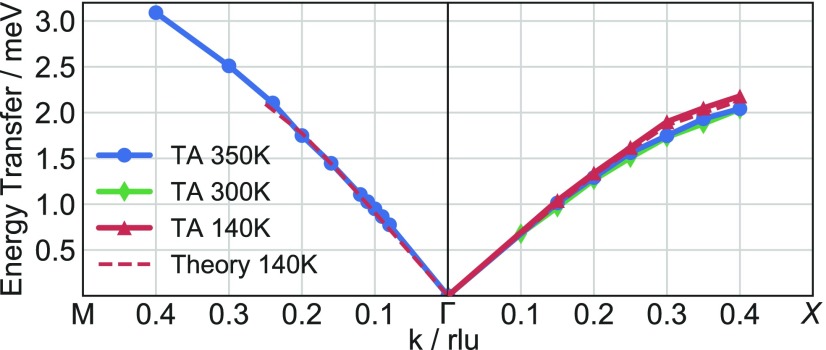
Fig. 2.
TA phonon dispersions along . Blue circles, green diamonds, and red triangles correspond to the cubic (350 K), tetragonal (300 K), and orthorhombic (140 K) phases, respectively. The dashed lines show the dispersion simulated from ab initio lattice-dynamics calculations. Reprinted with permission from ref. 30, which is licensed under CC BY-NC 3.0.

