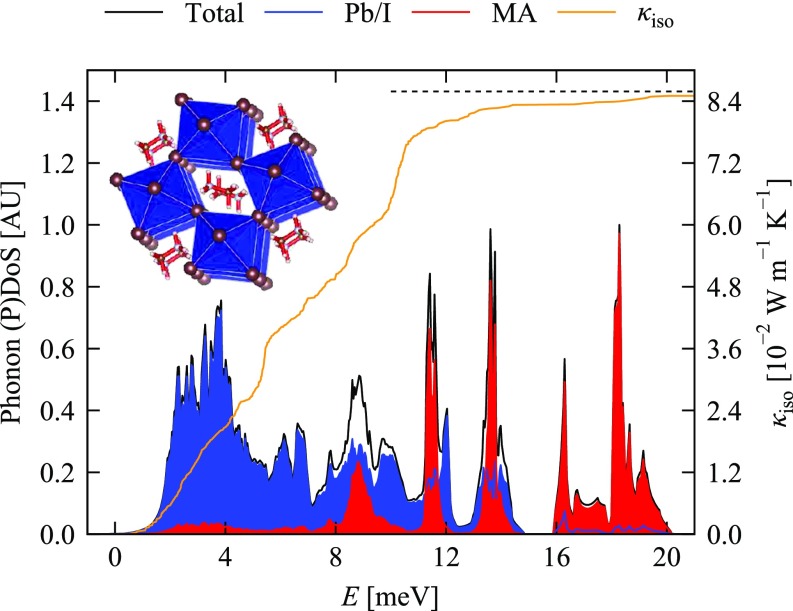
Fig. 3.
Phonon DoS of MAPI for phonon energies from 0 to 20 meV (black) with projections onto the Pb–I cage (blue) and MA cation (red). The cumulative lattice thermal conductivity at 300 K is overlaid in orange. The dashed black line shows the total thermal conductivity summed over all modes, including the “pure” molecular modes at higher energies. (Inset) Schematic of orthorhombic-phase MAPI crystal structure with Pb–I octahedral cage in blue and MA cation in red. Reprinted with permission from ref. 30, which is licensed under CC BY-NC 3.0.

