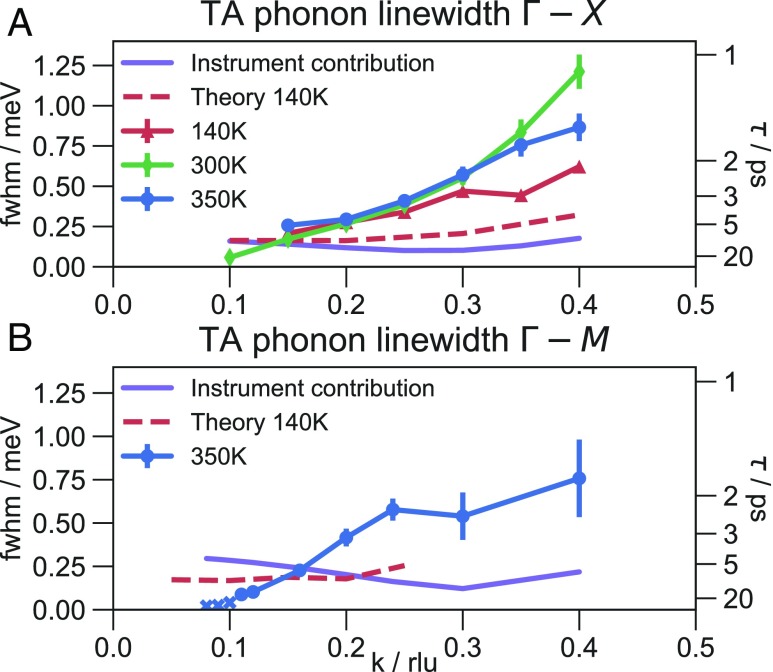
Fig. 4.
Intrinsic TA phonon linewidths and lifetimes. Error bars represent the SE in the fitted values; errors in the orthorhombic phase are larger due to crystal twinning. Cross markers denote fitted values below the resolution limit. Dashed lines show the calculated linewidths of the orthorhombic phase. Purple lines show the instrumental contribution to the linewidths. (A) TA phonon along in the orthorhombic (140 K), tetragonal (300 K), and cubic (350 K) phases. (B) TA phonon along in the cubic phase (350 K). Reprinted with permission from ref. 30, which is licensed under CC BY-NC 3.0.

