Fig. 2.
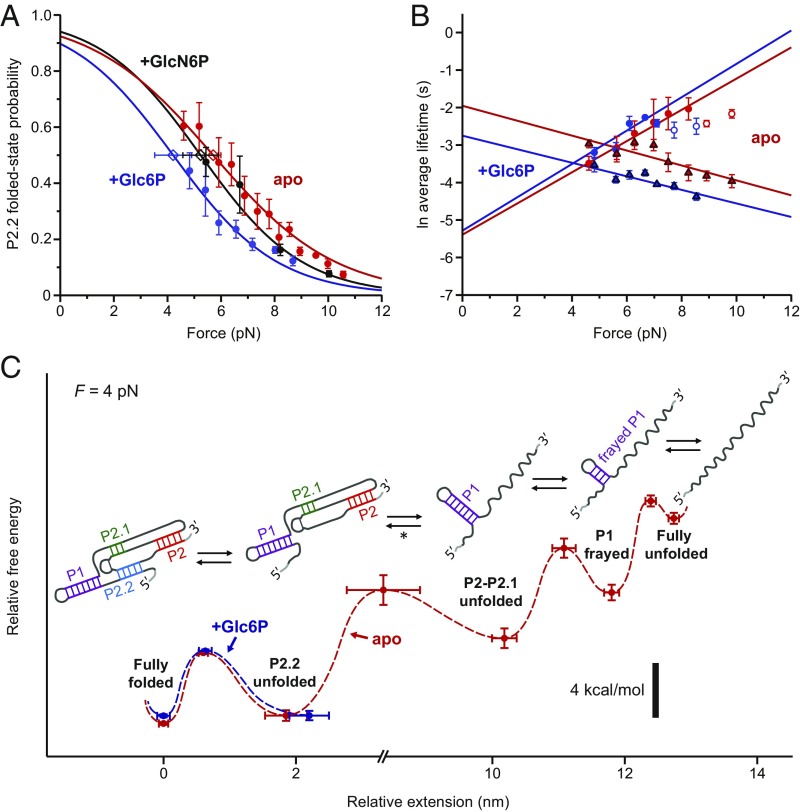
P2.2 folding is not stabilized in the presence of cofactor. (A) Force dependence of Pfolded(P2.2), with Boltzmann sigmoidal fits (Materials and Methods), for various ligand conditions. Open diamonds: F1/2 values from fits, with error bars indicating SE. (B) Force dependence of P2.2 ln(τfolded), triangles, and ln(τunfolded), circles, with linear fits (Materials and Methods). White-filled circles: higher-force ln(τunfolded) data which deviated from linearity, not used for fitting. Apo and +G6P Pfolded fits in A are to region with linear ln(τunfolded) vs. force. (A and B) Data points: averages from ≥3 traces (>100 folding/unfolding events per trace); error bars: SEM. (C) Reconstructed free energy landscape for folding of the core glmS ribozyme, displayed for 4-pN applied load (red dashed line, apo state; blue dashed line, +Glc6P). Potential wells correspond to experimentally observed folding states (labeled); barrier heights were derived from the load dependencies of the transition rates between these states (mean ± SE). Cartoons depict the RNA secondary structures for these states deduced from the data. Note the break in scale. [*: ∆x for this broad transition was ∼3.5 nm less than expected for complete P2–P2.1 folding plus P1 reorientation at F1/2 = 10.0 pN, possibly attributable to a separate P1 reorientation step that was obscured by noise or drift (Materials and Methods).]

