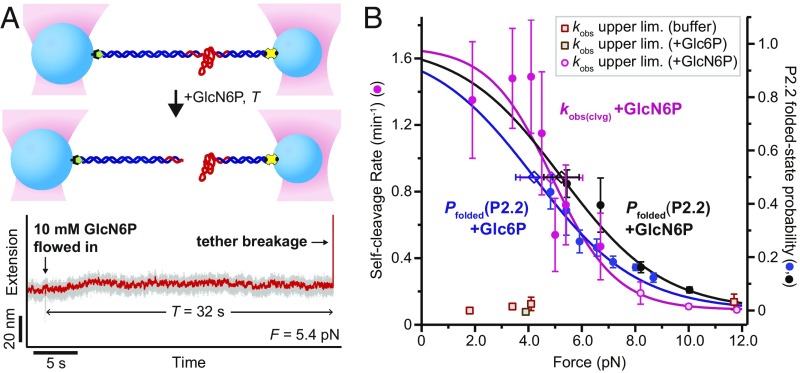
Fig. 3.
Folding and self-cleavage of the core glmS ribozyme. (A, Top) Schematic of the single-molecule self-cleavage assay. Trapping geometry as in Fig. 1B. (A, Bottom) Example self-cleavage experiment trace (gray, raw data; red, median-smoothed). (B) Self-cleavage rate kobs(clvg), left axis, overlaid with Pfolded(P2.2), right axis, with sigmoidal fits (Materials and Methods). Pfolded data shown are same as in Fig. 2A. Cleavage rate data points: averages from ≥4 independent measurements; error bars: SEM. Open diamonds: folding F1/2 and rate Fmax/2 from fits (error bars, SE).

