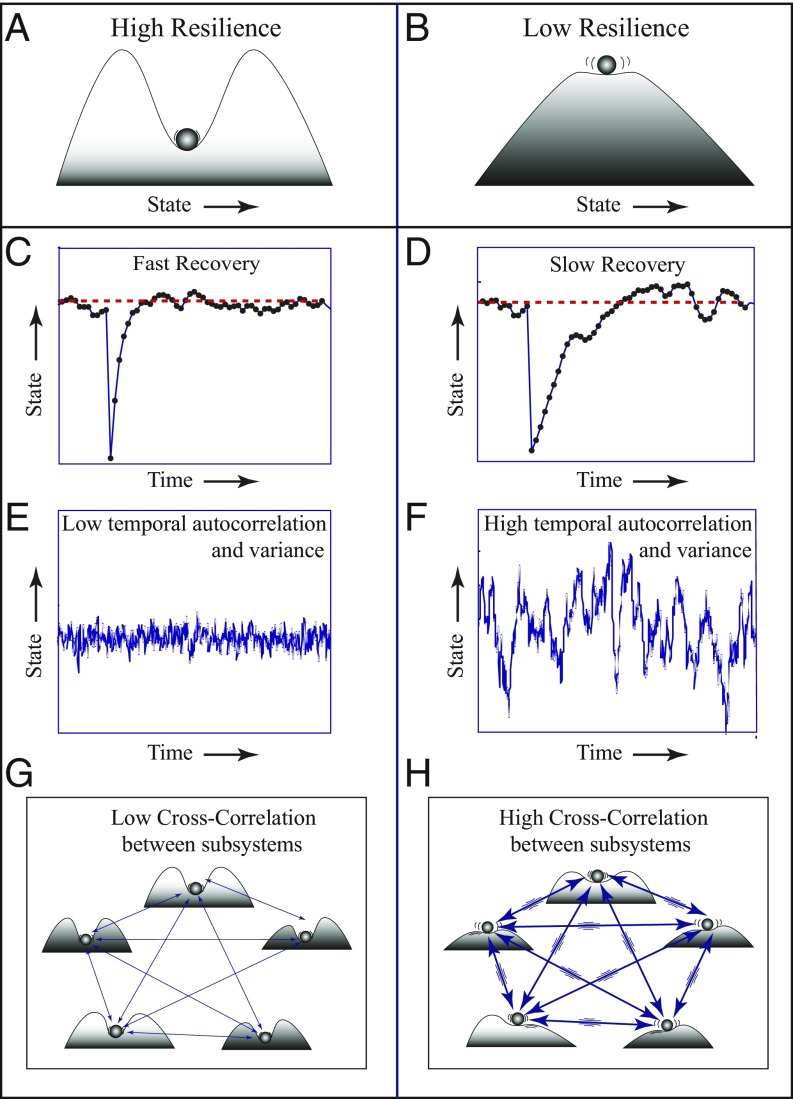
Fig. 2.
DIORs discussed in the main text. (Left) A resilient system. (Right) A frail system with low resilience. (A and B) Resilience is represented as the basin of attraction around a healthy state. Slopes correspond to rates of change. When resilience is low (B vs. A), slopes around the equilibrium are less steep, implying slower return rates to equilibrium. (C and D) Simulated recovery rates upon a small perturbation. (E and F) Simulated dynamics in a system subject to a stochastic regime of perturbations illustrating that fluctuations are larger and slower in a frail system (F vs. E), as reflected in higher variance and higher temporal autocorrelation. (G and H) Interactive dynamics of subsystems (e.g., mood, posture, cognition) are predicted to become more correlated in a network with low systemic resilience (H vs. G).

