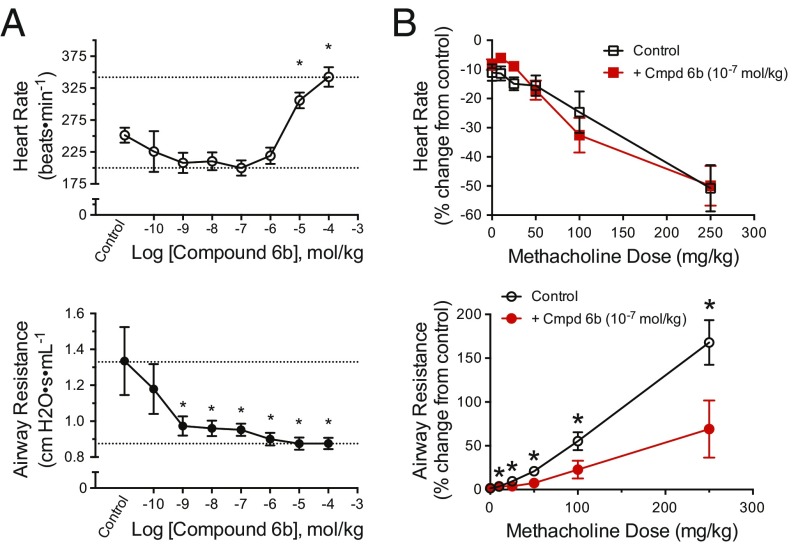
Fig. 3.
In vivo selectivity of compound 6b. (A) Average (±SEM) heart rate (Top) and airway resistance (Bottom) response to methacholine with a 6b cumulative dose–response curve. Airway resistance was significantly decreased from the control response to methacholine, suggesting inhibition of the M3R at a 6b dose of 109 mol/kg. Heart rate was significantly higher than that of the control, indicating inhibition of the M2R at a 6b dose of 105 mol/kg. The asterisk indicates a significant difference from control: *P < 0.05, one-way repeated-measures ANOVA. (B) Average (±SEM) percent change from control heart rate (Top) and airway resistance (Bottom) response to methacholine dose–response with pretreatment of either saline (black) or 6b 107 mol/kg (red). The airway resistance response to methacholine was significantly different in mice treated with 6b (*P < 0.05) compared with saline. There was no significant difference in the mean heart rate response between treatments. Cmpd, Compound.

