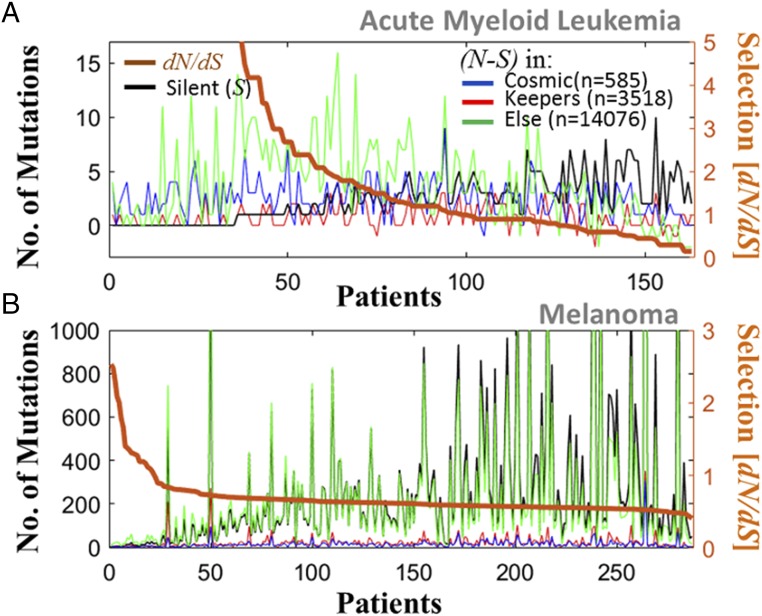
Fig. 3.
Distribution of mutations in different groups of genes, in cancer with extreme ML values. (A) AML patients (n = 163). The number of N minus the number of S mutations (left y axis) indicates the excess of N mutations in each group of genes separately (color). The number of S mutations in the entire proteome is superimposed (black). Patients are ordered by the dN/dS acting on the proteome (right y axis). (B) Melanoma patients (n = 287). In AML, for more than half of the patients, dN/dS > 1, and cancer genes harbor a substantial fraction of the N mutations. In melanoma, dN/dS is below unity in the vast majority of patients, and dN/dS sharply drops with the number of mutations in the proteome, which, coupled with β < 0, indicates mutation meltdown (Muller’s ratchet).

