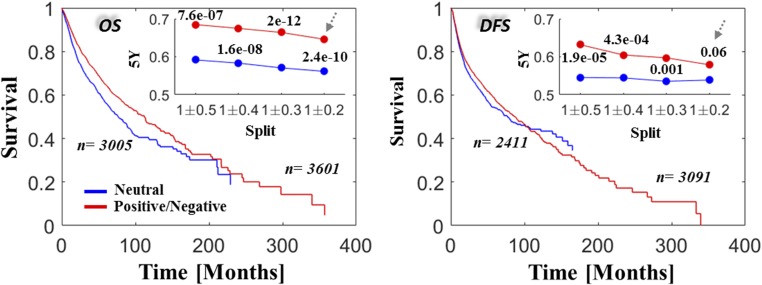
Fig. 5.
Selection versus survival in the pan-cancer data. KM OS (Left) and DFS (Right) rates are compared across all studies for cases of neutral evolution (intermediate values around dN/dS = 1, blue) and cases of positive and negative selection (red). Insets depict the 5-y survival rates and the corresponding P values of log-rank tests for each cutoff. The survival curves in the larger panels correspond to the case of dN/dS = 1 ± 0.2 as indicated by the arrows in the Insets. Complementary Cox regression analysis, stratifying by cancer types, is provided in Table 1.

