Fig. 2.
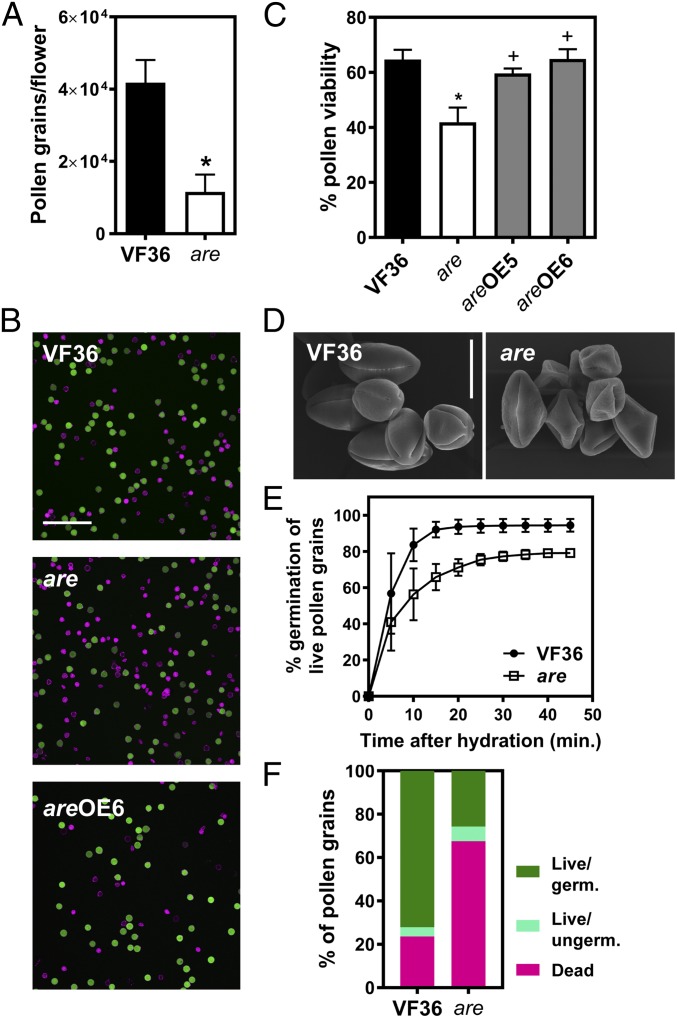
Flavonols control pollen viability and germination in tomato. (A) Quantification of pollen grains in VF36 and the are mutant. Pollen grains per flower were quantified by flow cytometry. Data are mean ± SEM of three independent experiments with two to three flowers per experiment. (B) Confocal micrographs of VF36, are, and are-35S:F3H complementation line #6 pollen grains stained with FDA (live pollen grains, shown in green) and PI (dead pollen grains, shown in magenta). (Scale bar, 200 µm.) (C) Quantification of pollen viability in VF36, are, and are-35S:F3H complementation lines. Data are shown as the mean ± SEM of two independent experiments. Asterisks indicate significant differences between VF36 and other genotypes and plus signs differences between are and complementation lines, according to an ANOVA followed by a Šídák post hoc test with P < 0.05. (D) Scanning electron micrographs of VF36 and are pollen grains collected at anthesis. (Scale bar, 20 µm.) (E) Quantification of germination rates in VF36 and the are mutant. Data are shown as the mean ± SEM of three independent experiments. (F) Summary of pollen viability and germination rates in VF36 and the are mutant.

