Fig. 5.
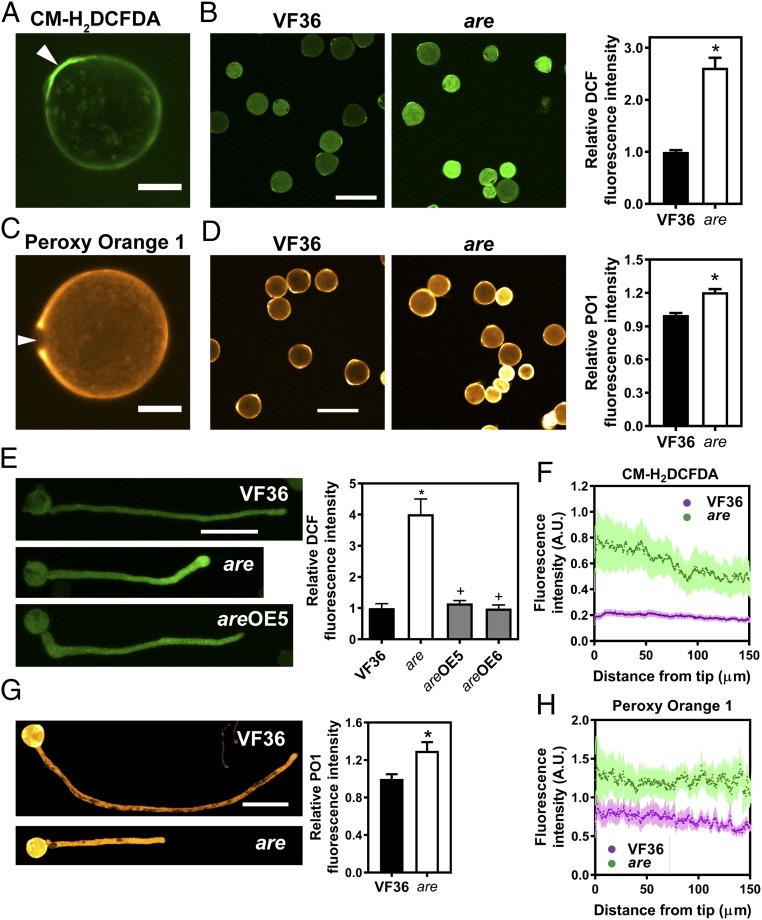
ROS levels are increased in the are mutant. (A) Confocal micrograph of a VF36 (wild-type) pollen grain stained with the generic ROS sensor CM-H2DCFDA. (Scale bar, 10 μm.) (A and C) Arrows point to the pollen aperture. (B) Confocal micrographs of VF36 and are mutant pollen grains stained with CM-H2DCFDA. (Scale bar, 50 μm.) The graph represents quantification of DCF fluorescence in pollen grains of VF36 and the are mutant. (B, D, and G) Data are the mean ± SEM. Asterisks indicate significant differences between VF36 and the are mutant, according to a Student’s t test with P < 0.05. (C) Confocal micrograph of a VF36 pollen grain stained with the hydrogen peroxide-specific probe PO1. (Scale bar, 10 µm.) (D) Confocal micrographs of VF36 and are mutant pollen grains stained with PO1. (Scale bar, 10 μm.) The graph represents quantification of PO1 fluorescence in pollen grains of VF36 and the are mutant. (E) Confocal micrographs of VF36, are and are-35S:F3H complementation line #5 pollen tubes stained with CM-H2DCFDA. (Scale bar, 50 µm.) Quantification of DCF fluorescence in pollen tubes of VF36, are, and are-35S:F3H complementation lines. Data are shown as the mean ± SEM. n = 20–26 tubes measured across two independent experiments. Asterisks indicate significant differences between VF36 and other genotypes and plus signs differences between are and complementation lines, according to an ANOVA followed by a Šídák post hoc test with P < 0.05. (F and H) Quantification of CM-H2DCFDA and PO1 fluorescence along pollen tubes of VF36 and are, respectively. Dotted lines represent the average fluorescence for 10 pollen tubes, while lightly shaded areas represent the SEM. (G) Confocal micrographs of pollen tubes stained with PO1. (Scale bar, 100 µm.) The graph represents quantification of PO1 fluorescence in maximum intensity projections of z-stacks in pollen tubes of VF36 and the are mutant.

