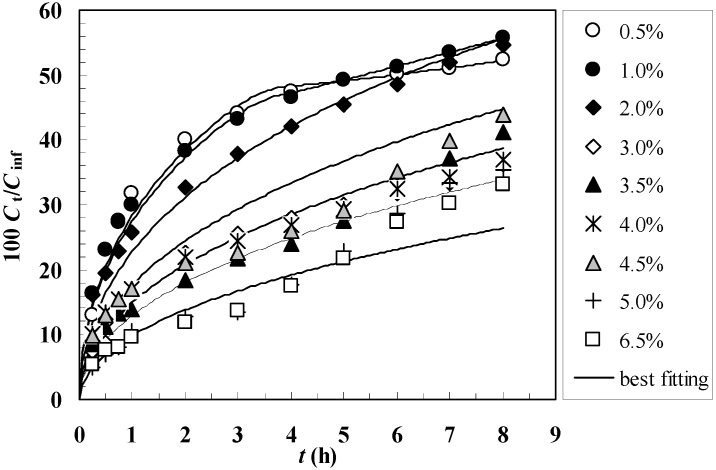
Figure 3.
Comparison between model best fitting (solid line) and experimental release data (symbols) referring to gels characterized by different polymer concentrations Cp (0.5% - 6.5%). Ct and Cinf indicate the drug concentration in the release environment after time t and after a very long time (infinite), respectively.

