. 2018 Nov 26;7:e43326. doi: 10.7554/eLife.43326

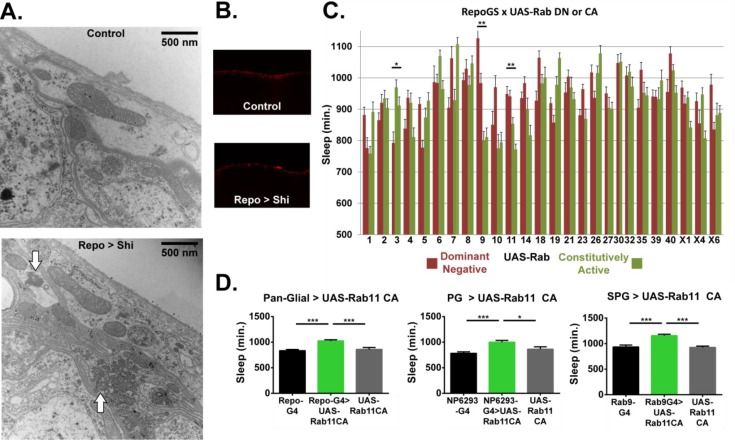
Figure 4. Ultrastructural morphology and genetic analysis of Rab proteins support a sleeprelevant function of vesicle trafficking in surface glia.

(A) Transmission electron micrographs of surface glia of individual Repo-GAL4 > UAS-20xShi.ts1 and Control female fly brains. Perineurial glia are the most superficial layer with subperineurial glia appearing as the generally thinner and darker layer immediately basal to the perineurial glia. White arrows indicate presence of microtubule bundles. (B) External aspect of hemolymph-brain barrier visualized by injection and fixation of Alexa647-10kd dextran in Repo-GAL4 > USA-20xShi.ts1 and control brains, demonstrating an intact barrier in both genotypes. (C) Total sleep time of RepoGS > UAS Rab CA or DN flies, in the absence of RU486. Red bars represent UAS-Rab DN and green bars are UAS-Rab CA, with two insertions available in most cases (n = 7–16, for all genotypes). Significant Rabs are those in which all DN lines were consistently and significantly different from all CA lines measured by one-way ANOVA with Holm-Sidak post-hoc test or unpaired t-test for Rab30, with *p<0.05, **p<0.01, ***p<0.001. Displayed significance value represents the largest p-value of the 3–4 comparisons. Error bars represent standard error of the mean (SEM). (D) Total sleep time of flies expressing Rab11 CA in all glia (Repo-GAL4), perineurial glia (NP6293-GAL4), and subperineurial glia (Rab9-GAL4) as compared to GAL4 and UAS controls (n = 15–30), statistics as above.

Figure 4.

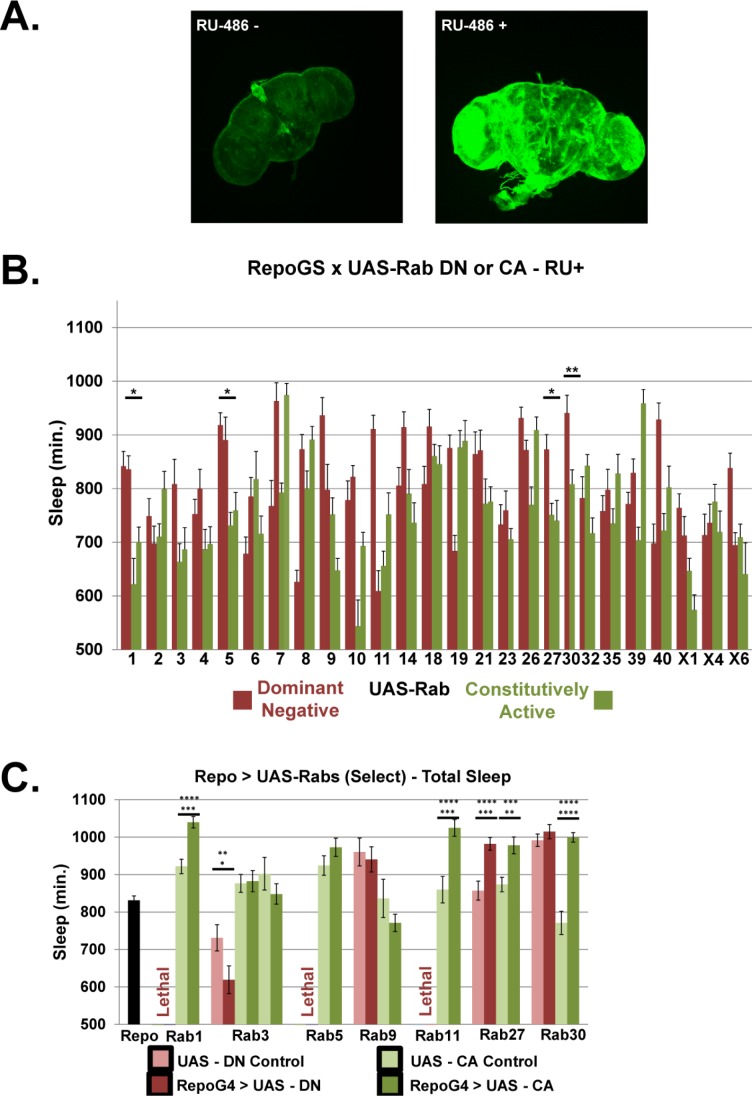
Figure 4—figure supplement 1. Rab screen with pan-glial driver Repo-GS and Repo-GAL4.

Figure 4—figure supplement 1.

(A) Maximum projection z-stack confocal images of brains from Repo-GeneSwitch >CD8::GFP flies in the presence and absence of RU486. Confocal imaging parameters are kept constant to demonstrate difference in expression between conditions. (B) Total sleep time of Repo-GeneSwitch > UAS Rab CA and DN flies, in the presence of RU486. Red bars represent UAS-Rab DN and green bars are UAS-Rab CA lines, n = 5–16, per each genotype. Significant Rabs are those in which all available DN lines were consistently and significantly different from all CA lines measured by One-way ANOVA with Holm-Sidak posthoc test or unpaired t-test for Rab30, *p<0.05, **p<0.01, ***p<0.001. Displayed significance value represents the largest p-value of the 3–4 comparisons between all DN and CA lines. Error bars represent standard error of the mean (SEM). (C) Total sleep time of flies with Repo-GAL4 driving select UAS-Rab CA and DN lines, including both parental controls. Lethality was seen for pan-glial expression of the DN constructs of Rab1, 5 and 11. One-way ANOVA with Holm-Sidak post-hoc test, *p<0.05, ** is p<0.01, *** is p<0.001. Error bars represent standard error of the mean (SEM). The top star(s) represent significance compared to Repo-GAL4 Control (n = 92, average five experiments), while bottom star(s) represent comparison to UAS Control. (n = 15–16, for each UAS Control and Experimental genotype).
Figure 4—figure supplement 2. Daytime sleep, sleep deprivation resistance and barrier integrity with Rab11 expression in surface glia.

Figure 4—figure supplement 2.

(A) Day sleep time of female flies expressing Rab11 CA in all glia (Repo-GAL4), perineurial glia (NP6293-GAL4), and subperineurial glia (Rab9-GAL4) as compared to GAL4 and UAS controls (n = 15–30). One-way ANOVA with Holm-Sidak post-hoc test with *p<0.05, **p<0.01, ***p<0.001. Error bars represent standard error of the mean (SEM). (B) Sleep during deprivation for Repo-GAL4 and driving UAS-Rab11 CA for female flies (n = 16, each genotype). Statistics as above. (C) Intact hemolymph-brain barrier visualized by injection and fixation of Alexa647-10kd Dextran in Repo-GAL4 > UAS-Rab11::YFP and UAS-CD8::GFP control brains.