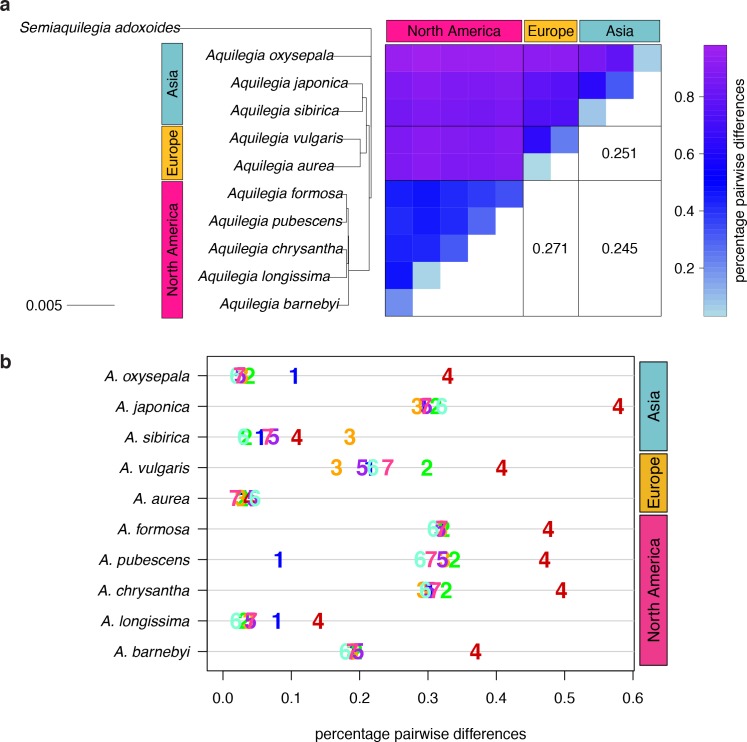
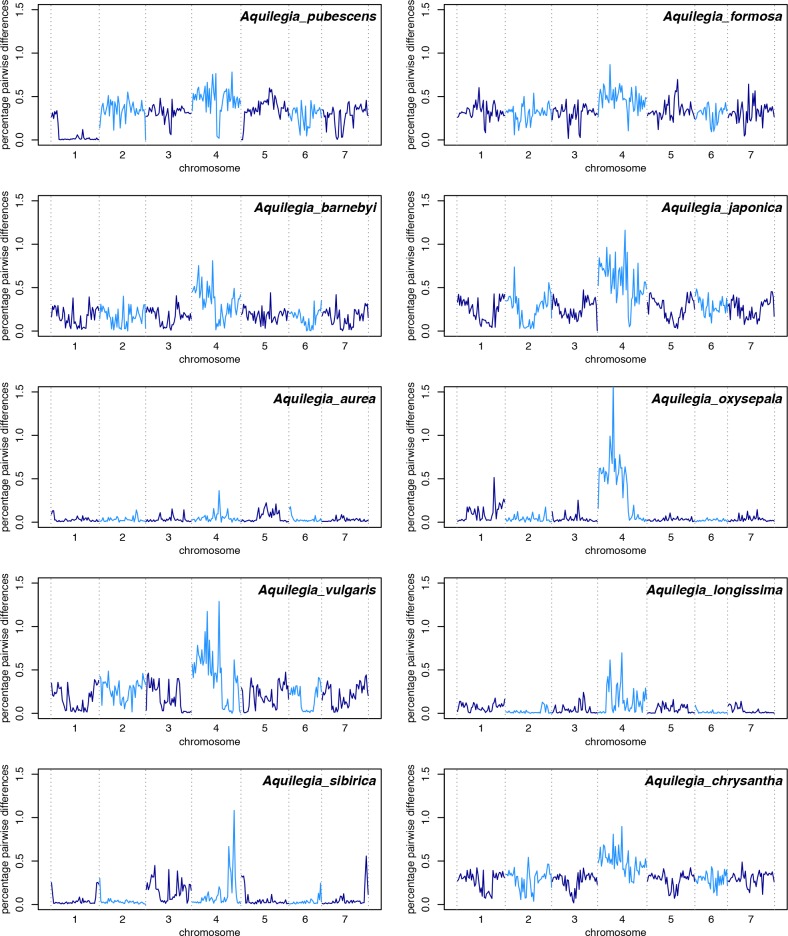
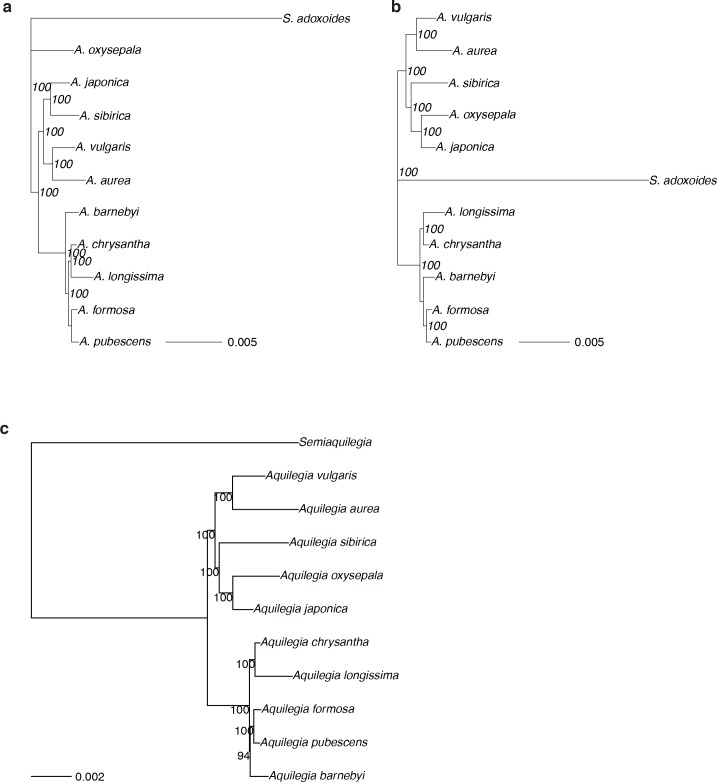
Figure 2. Polymorphism and divergence in Aquilegia.
(a) The percentage of pairwise differences within each species (estimated from individual heterozygosity) and between species (divergence). values between geographic regions are given on the lower half of the pairwise differences heatmap. Both heatmap axes are ordered according to the neighbor joining tree to the left. This tree was constructed from a concatenated data set of reliably-called genomic positions. (b) Polymorphism within each sample by chromosome. Per-chromosome values are indicated by the chromosome number.


