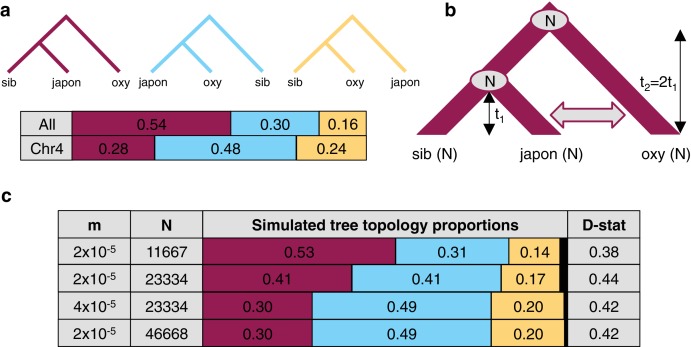
Figure 6. The effect of differences in coalescence time and gene flow on tree topologies.
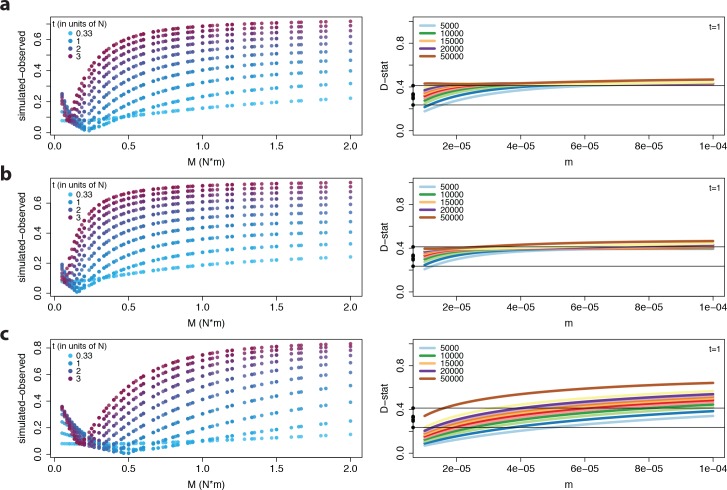
(a) The observed proportion of informative derived variants supporting each possible Asian tree topology genome-wide and on chromosome four. Species considered include A. oxysepala (oxy), A. japonica (japon), and A. sibirica (sib). (b) The coalescent model with bidirectional gene flow in which A. oxysepala diverges first at time t2, but later hybridizes with A. japonica between t = 0 and t1 at a rate determined by per-generation migration rate, m. The population size (N) remains constant at all times. (c) The proportion of each tree topology and estimated D statistic for simulations using four combinations of m and Nvalues (t1 = 1 in units of N generations). The combination presented in the first row (m = 2x10⁻⁵ and N = 11667) generates tree topology proportions that match observed allele sharing proportions genomewide. Simulations with increased m and/or N (rows 3–4) result in proportions which more closely resemble those observed for chromosome four. Colors in proportion plots refer to tree topologies in (a), with black bars representing the residual probability of seeing no coalescence event. While this simulation assumes symmetric gene flow, similar results were seen for models incorporating both unidirectional and asymmetric gene flow (Figure 6—figure supplements 1 and 2).


