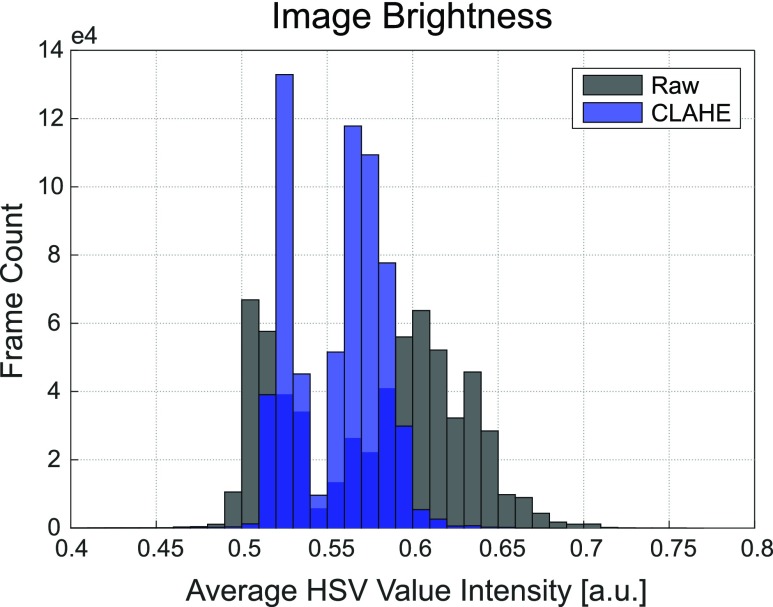
FIGURE 4.
Mean frame brightness before and after CLAHE normalization. Overlaid distributions of the average image brightness before (gray) and after (blue) CLAHE confirm that the lighting conditions across images are more similar after equalization. Average brightness of a frame was measured by taking the mean of a frame’s value-layer intensity. Each histogram used the entire Subject 2 dataset ( = 625,127 frames).

