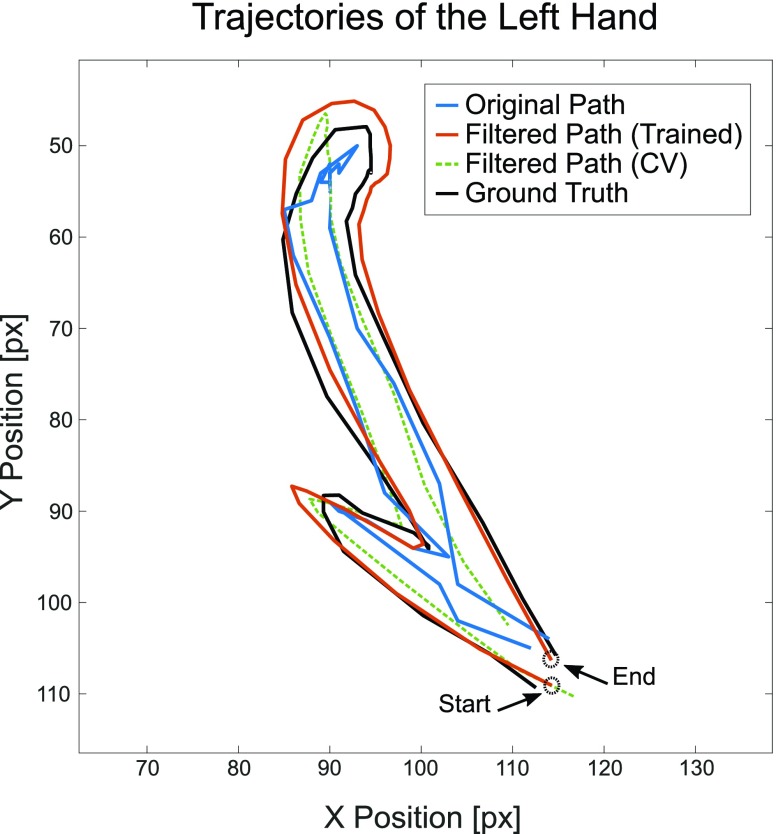
FIGURE 6.
Comparison of trajectories. Estimated  coordinates of S1’s left hand during an example segment of movement before (blue) and after (orange) using a Kalman filter with fitted noise parameters, as compared to the ground truth (black). A filtered path using constant velocity (CV) noise parameters (green) is also provided for reference. Across all testing data for Subject 1’s left hand, the trained Kalman filter produced a lower average prediction error of 8.23 ±5.19 pixels from the ground truth, compared to the original path’s error of 10.42 ±5.85 pixels.

