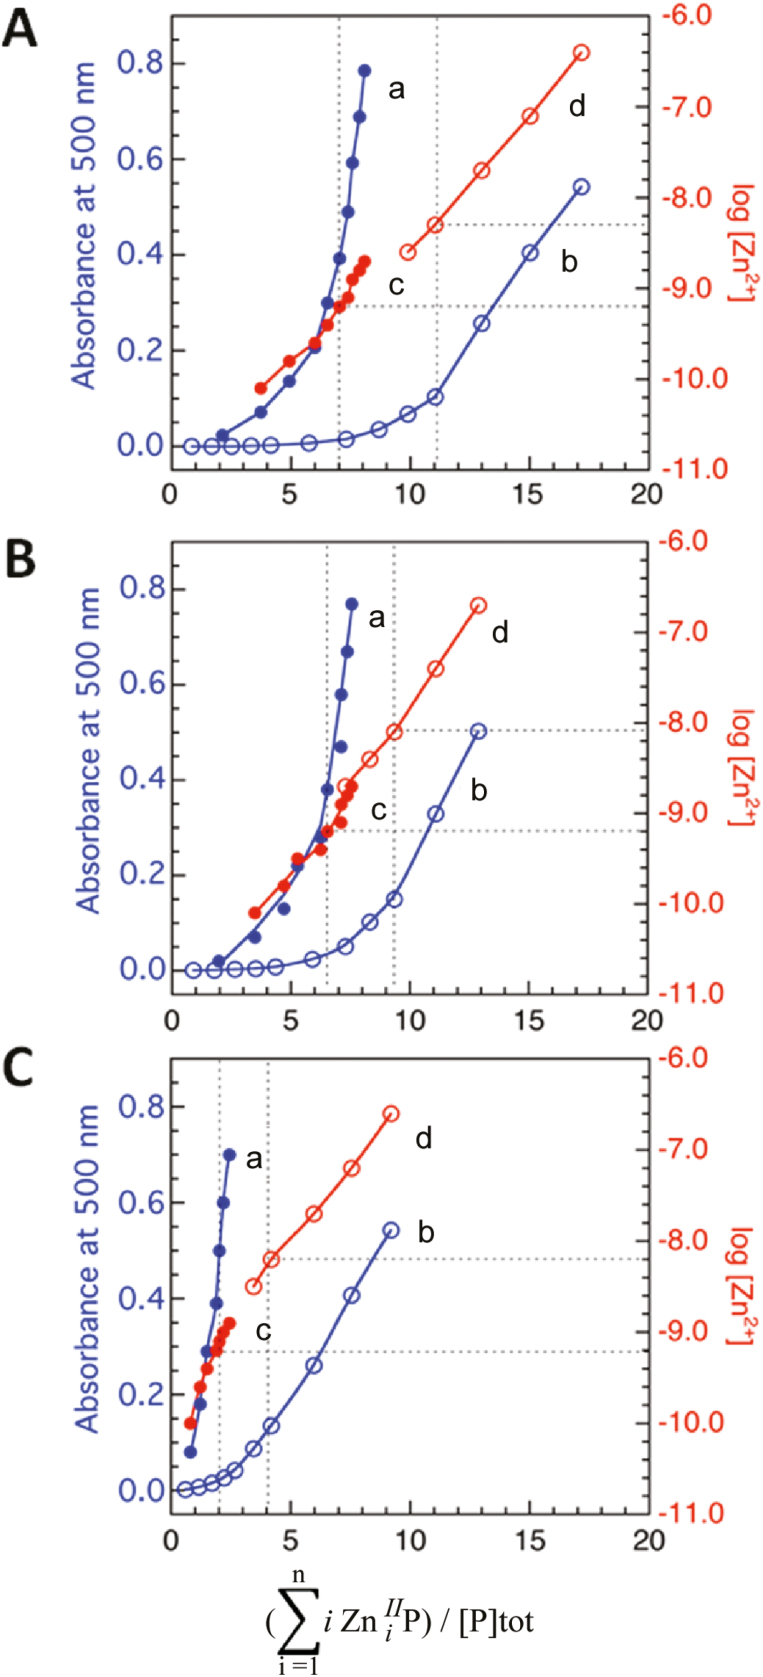
Fig. 6.
Quantification of Zn2+ binding affinity and stoichiometry of isolated proteins AtHMA4c (A), AhHMA4c (B), and AtHMA4CCAAc (C) with Par probe at either 22 µM (open circles) or 111 µM (solid circles). (a, b) Variation of A500 with average zinc binding stoichiometry of proteins; (c, d) Variation of log [Zn2+] with average zinc binding stoichiometry of proteins. The experiments were conducted by titration of each protein (1.0 µM) in MOPS buffer (50 mM, pH 7.3) containing NaCl (100 mM) and TCEP (1 mM) in the presence of excess Par ligand.

