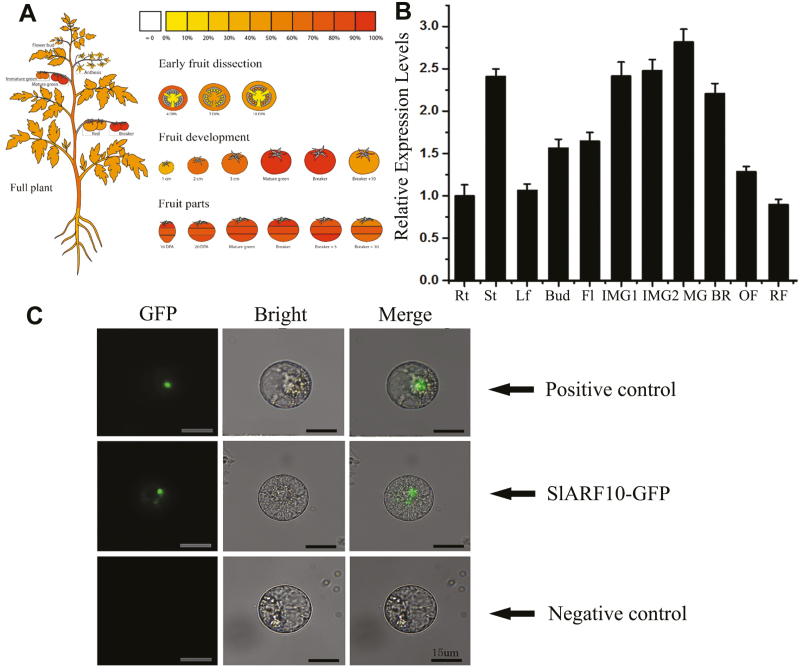
Fig. 1.
Expression patterns of the SlARF10 gene and subcellular localization analysis of the SlARF10 protein in tomato plants. (A) Online analysis of SlARF10 in tomato plants (see Methods). The degree of shading indicates the gene expression level. (B) qRT-PCR analysis of SlARF10 expression levels; the housekeeping gene ubiquitin was used as the reference. The data are means (±SD) of three biological replicates. Rt, root; St, shoot; Lf, leaf; Fl, flower; IMG, immature green fruit (IMG1, 4 d post-anthesis, DPA; IMG2, 18 DPA); MG, mature green fruit (35 DPA); BR, breaker fruit (40 DPA); OF, orange fruit (43 DPA); RF, red fruit (46 DPA). The fruit pericarp was used for total RNA isolation. (C) Subcellular localization analysis of the SlARF10 protein. PCX-DG-GFP was the negative control. Scale bars are 15 μm.

