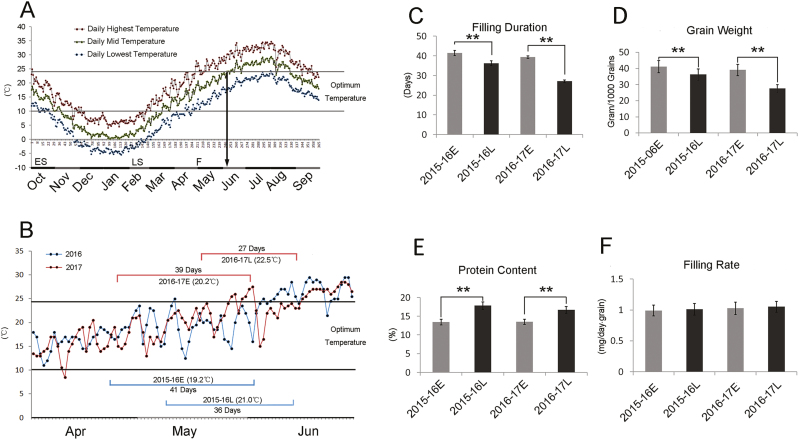
Fig. 1.
Effects of heat stress on filling wheat grains in the field. (A) Average air temperatures during the growing season for the years 2013–2017 at the experimental site in Yangling, China. The data show the mean daily highest, lowest, and mid-temperatures (i.e. mean of the highest and lowest). The two horizontal lines indicate the optimum temperature range for the grain-filling process. The arrow indicates the date at which the mid-temperature exceeded the optimum temperature for wheat grain filling, and most local varieties reach maturity by this time. The axis at 0 °C shows time in days. ES, early sowing time. LS, late sowing time; F, flowering time. (B) Temperature variation during the grain-filling stage in the two experimental growing seasons for early (E) and late (L) sowing. The average mid-temperature for each filling stage is indicated together with the average duration of the stage. (C–F) Filling duration, grain weight, protein content, and grain filling rate for 38 varieties. Data are means (±SD) based on six replicates per variety. Significant differences were determined using two-tailed, paired sample comparison t-tests: **P<0.01. (C) Filling duration is reduced with late sowing. (D) Grain weight is decreased with late sowing. (E) Grain protein content is increased with late sowing. (F) Filling rate is unchanged with late sowing. Filling rate was calculated as (grain weight)/(filling duration).

