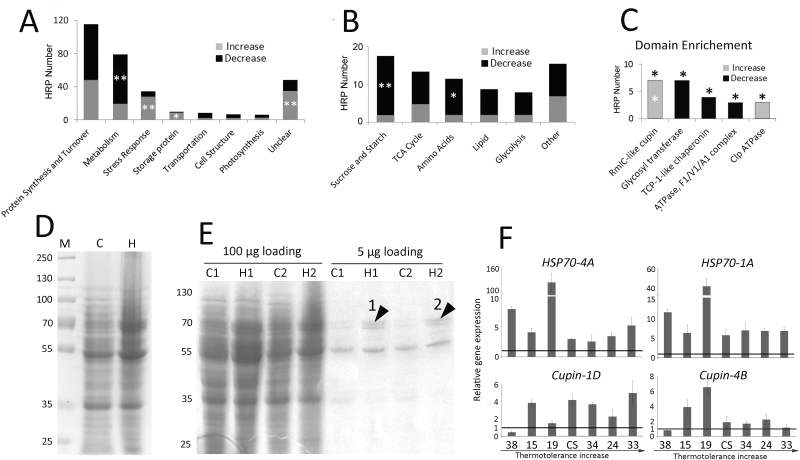
Fig. 4.
Category analysis of heat-responsive proteins (HRPs) and increased storage proteins in mature grains of the wheat variety Chinese Spring subjected to heat stress under controlled conditions. (A) Distribution of HRPs among different categories. HRPs in the category ‘Metabolism’ are decreased, whereas those in the categories ‘Stress response’ and ‘Storage protein’ are increased as a result of heat stress (Chi-square test: *P<0.05, **P<0.01). The full list of category classifications of HRPs is shown in Supplementary Table S4. (B) Distribution of HRPs in each sub-category of ‘Metabolism’. (C) Enriched protein domains in HRPs. Asterisks above the bars indicate that the domain was significantly enriched in HRPs (Fisher’s exact test, P<0.05) and an asterisk inside the bar indicates that proteins with the domain were significantly increased or decreased (Chi-square test, P<0.05). (D) Proteins with mass ~70 kD were induced in the mature heat-stressed grains. Protein samples were extracted from mature grains with and without heat stress. Equal quantities of protein were loaded onto each lane. M, marker; C, control conditions; H, heat-stressed conditions. Numbers on the left indicate the molecular weight of the proteins (kD). (E) A band around 70 kD is dramatically induced in mature heat-stressed grain. C1 and C2 refer to two independent samples from the control conditions, and H1 and H2 refer to two independent samples from the heat-stressed conditions. Bands 1 and 2 (marked with arrowheads) were selected for MS analysis to identify and quantify the storage proteins in these bands (see Methods). The MS results are shown in Supplementary Table S6. (F) The transcriptional response of HSP70 and Cupin in wheat accessions with different levels of heat resistance (x-axis, see Supplementary Table S1). Gene expression is expressed relative to that of Actin. Gene names are assigned according to the gene and its chromosome location shown in Supplementary Table S4. Data are means (±SD) from three biological replicates. The horizontal lines represent a fold-change of 1, i.e. no change under heat stress.

