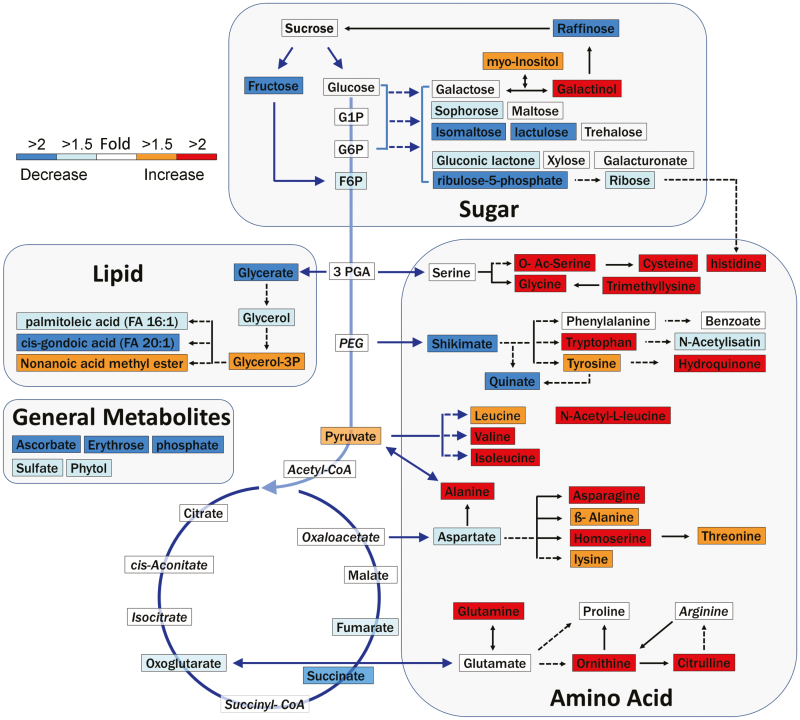
Fig. 6.
Changes in metabolites in response to heat stress. The identified metabolites were mapped to the carbohydrate metabolic pathways in the KEGG reference pathways. Red and blue boxes represent significantly increased and decreased metabolites, respectively (t-test, P<0.05). White boxes represent metabolites with no significant changes. Italics indicate metabolites that were not detected in this experiment. Arrows with solid lines indicate direct precursors and products, while arrows with dashed lines refer to indirect precursors and products.

