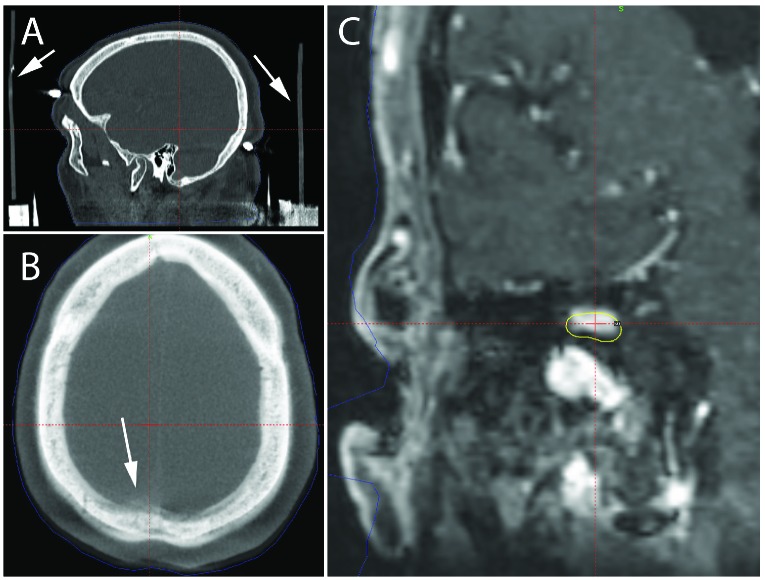
Figure 1.
Treatment planning imaging for a right vestibular schwannoma. (A) The post frame placement diagnostic CT demonstrates positional shift during image acquisition, most clearly indicated by bending of the straight vertical bars of the head frame as shown by the white arrows. (B) The fusion of the Icon CBCT and diagnostic pre-procedural CT in the axial plane demonstrates misalignment, most evident in the area indicated by the white arrow. (C) The treatment plan defined by the diagnostic CT placed over the treatment planning MR co-registered to the CBCT-based stereotactic coordinates demonstrates significant portions of GTV that would have been undertreated and areas of normal parenchyma that would have received full prescription dose.

