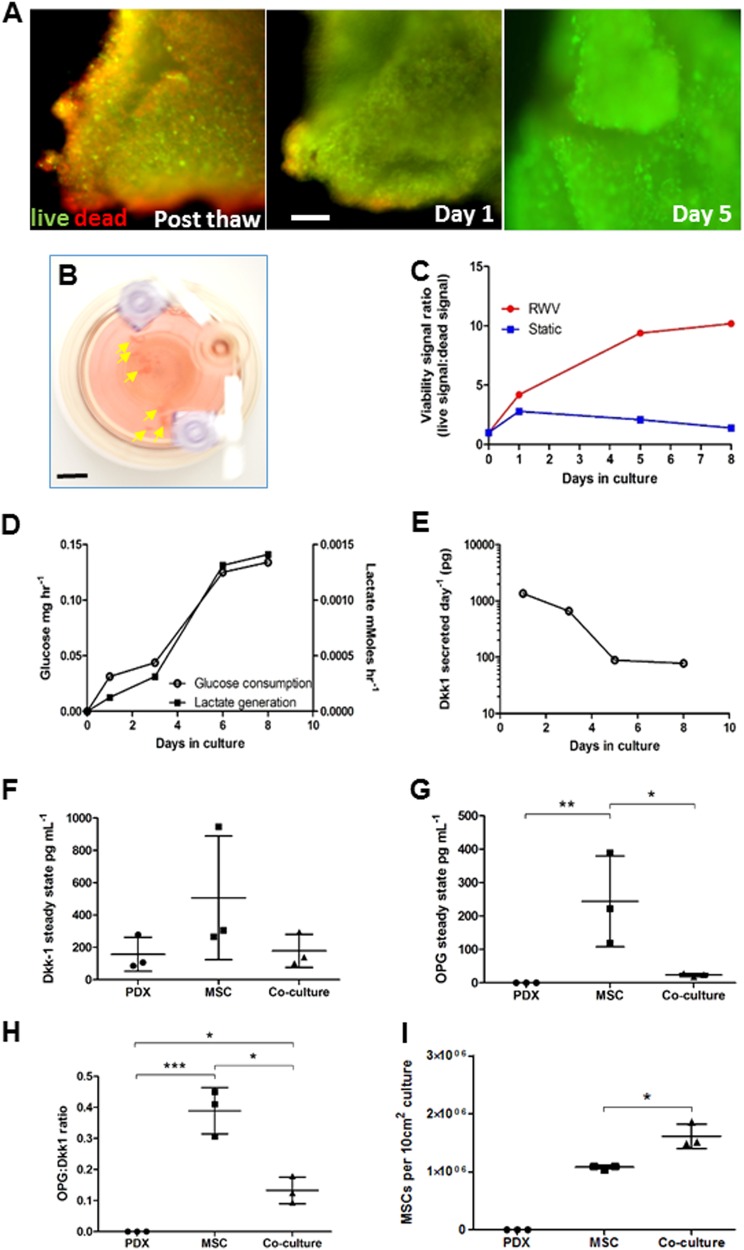
Fig. 7. Growth of PDX specimens in the RWV.
a Fluorescence micrographs of live/dead-stained PDX fragments immediately after recovery from cryopreservation (Post thaw) and after RWV culture. The green channel indicates live CalceinAM-positive cells and the red channel indicates dead propidium iodide-positive dead cells (bar = 100 μm). b RWV cultures containing OS PDX fragments (arrowed) (bar = 10 mm). c Viability status of PDX specimens as a ratio of green fluorescence intensity (live) to red fluorescence intensity (dead) over time in RWV culture or static culture. Typical result from 3 × 4 mm3 fragments. Experiment was performed on two individual tumor specimens. d Glucose consumption and lactate generation by OS PDX cultures over time. Experiment was performed on two individual tumor specimens. e Dkk-1 output over time in RWV culture as measured by ELISA on media samples. f Dkk-1 output by 5 × 1 mm3 PDX fragments, OEhMSC-laden collagen-coated beads or co-cultures as measured by ELISA on 2-day conditioned media. g As in f, but measurements of OPG. h As in f, but ratios of OPG:Dkk-1 measurements. i Yields of OEhMSCs recovered from RWV cultures. Statistics: for c–e, data are means of six technical replicates from a representative of four cultures. For f–i, n = 3 and values are expressed as means and standard deviations, points represent individual measurements. Statistical treatment as in Fig. 2

