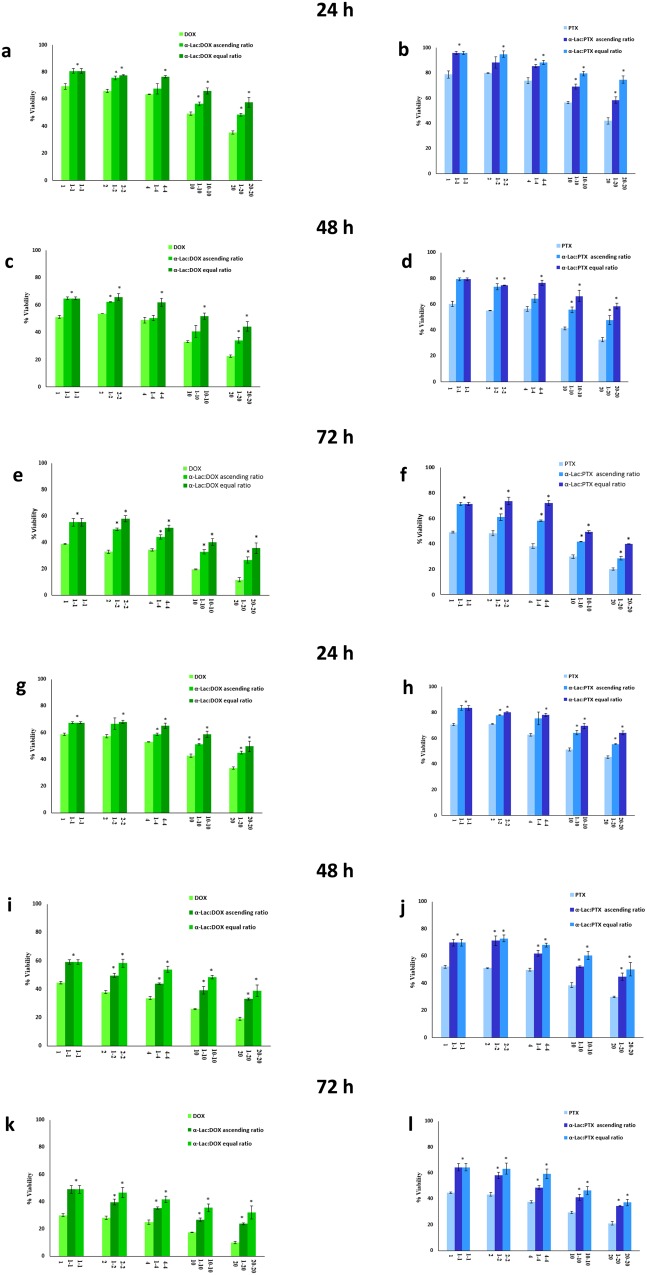
Figure 13.
MTT assay. Effect of DOX alone (1, 2, 4, 10, and 20 μM), PTX alone (1, 2, 4, 10, and 20 μM), and α-Lac (1, 2, 4, 10, and 20 μM) along with DOX or PTX (1, 2, 4, 10, and 20 μM) with equal (1:1, 2:2, 4:4, 10:10, and 20:20) and ascending ratios (1:2, 1:4, 1:10, and 1:20) in MDA-MB-231 (a–f) and T47D (g–l) cells. The cells were incubated with the described concentrations and ratios of α-Lac, DOX, and PTX for 24 (a,b,g and h), 48 (c,d,i and j), and 72 (e,f,k and l) (h). Cell viability was evaluated by MTT assay. The percent viability data were normalized to the corresponding control. The data represents an average ± SEM of three independent experiments. *represents p < 0.05 compared to the corresponding control.

