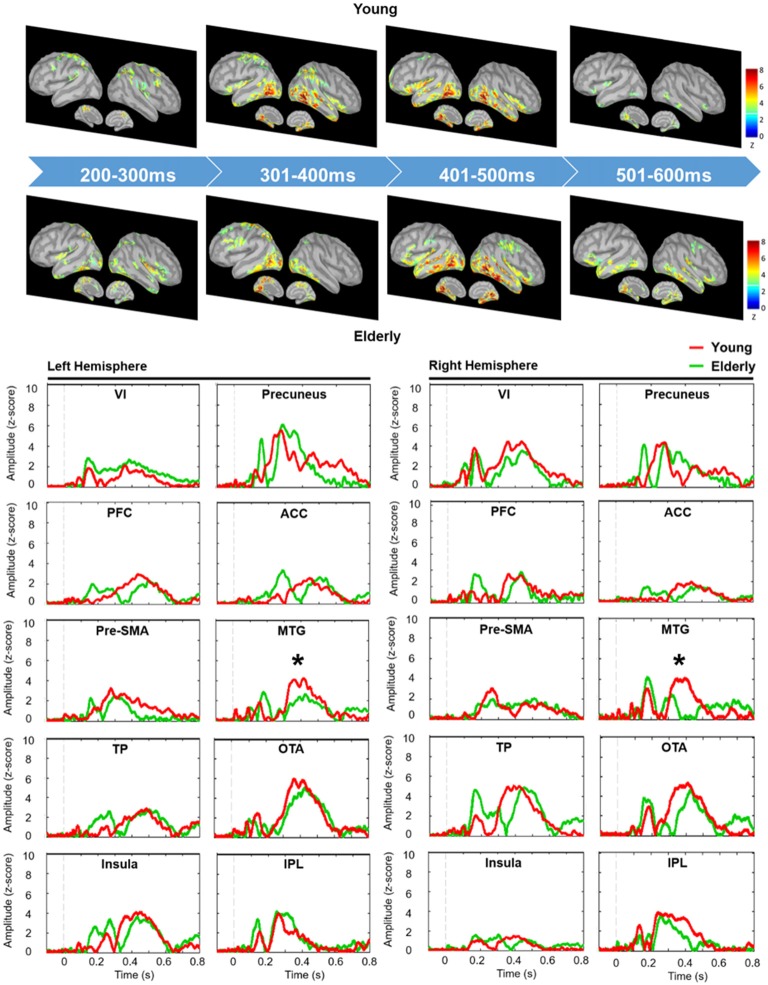
Figure 3.
Grand-averaged spatiotemporal dynamics (upper panel) and depth-weighted minimum norm estimate (wMNE) source waveforms (lower panel) of No-go trials in each group. Each wMNE cortical map was obtained by averaging cortical responses across every 100-ms time window from 200 ms to 600 ms. Source waveforms of each ROI were displayed from −100 ms to 800 ms in the younger (red traces) and older (green traces) groups. Asterisk represents the significant differences of peak amplitude. VI, primary visual cortex; PFC, prefrontal cortex; Pre-SMA, pre-supplementary motor area; TP, temporal pole; ACC, anterior cingulate cortex; MTG, middle temporal gyrus; OTA, occipitotemporal area; IPL, inferior parietal lobule.

