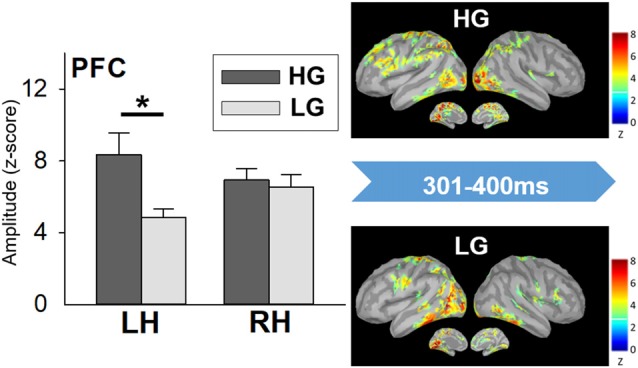
Figure 5.

Cortical spatiotemporal map during 301–400 ms (left panel) and PFC amplitude (right panel) in responses to No-go stimuli between high- and low-performers. Error bar represented the SEM. *p < 0.05. PFC, prefrontal cortex; LH, left hemisphere; RH, right hemisphere; HG, high-performing group; LG, low-performing group.
