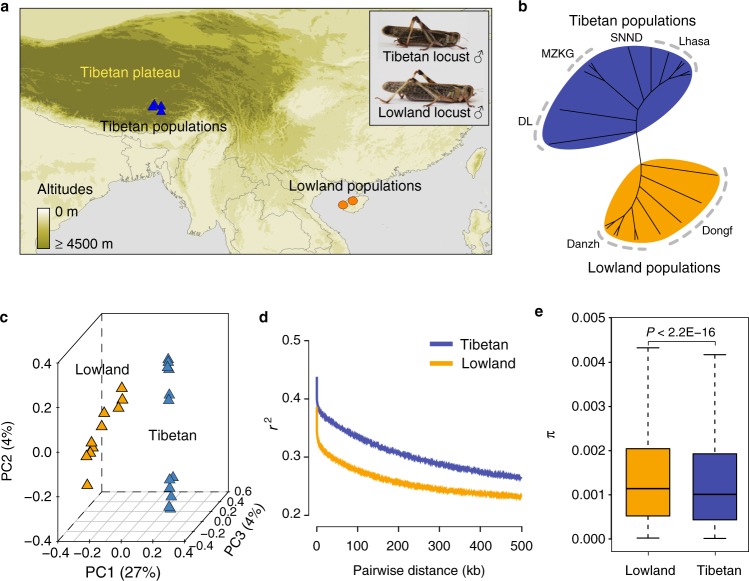
Fig. 1.
Phylogenetics of migratory locust based on whole-genome SNPs. a Geographic distribution of collected locust samples used for whole-genome re-sequencing. Tibetan and lowland locusts are shown at the top-right corner. b Unrooted neighbor-joining tree of migratory locust. c Principle component (PC) analysis. d Patterns of LD (linkage disequilibrium) decay across the genome in different geographic populations. r2, Pearson’s correlation coefficient. e Significant difference in population nucleotide diversity (π), as evaluated using the Wilcoxon rank-sum test (P < 2.2E−16). The boxplot represents mean value and variance. Maps were generated using DIVA-GIS (http://www.diva-gis.org/). Photographs of locusts were taken by D.D.

