Fig. 2.
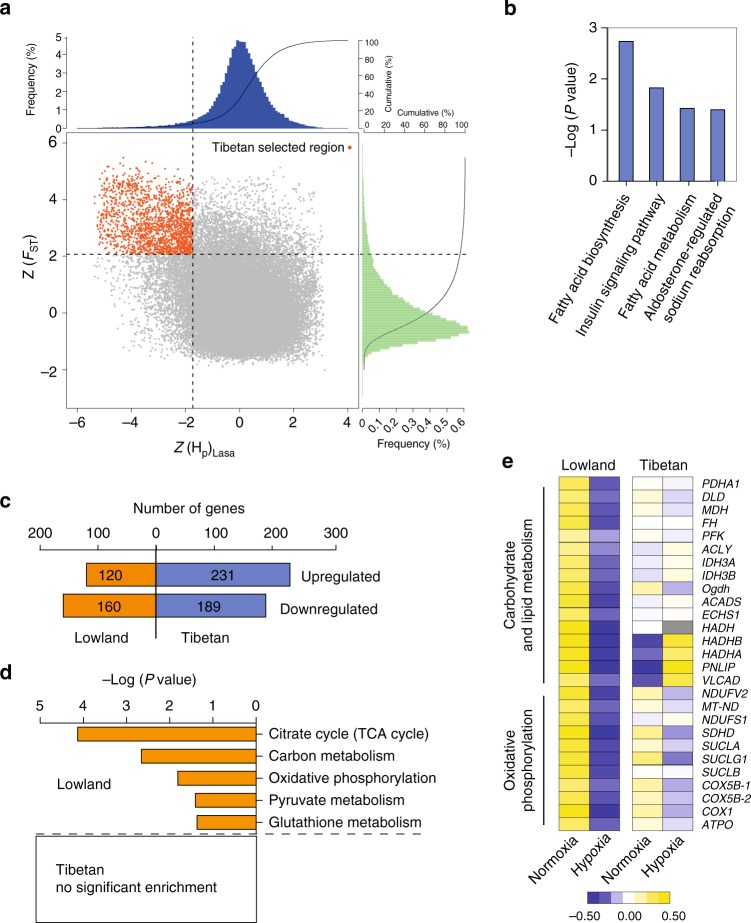
Selective sweep and expression analysis of hypoxia adaptation. a Distribution of Z-transformed fixation (ZFST) and heterozygosity (ZHP), calculated in 100-kb sliding windows. Genomic region (red point) located at top left of the dash lines (5% of empirical maximum FST and minimum HP) is identified as high-altitude adaptation-associated region in Tibetan locusts. Genes in this region are positively selected genes (PSGs). b KEGG enrichment of PSGs. c Number of differentially expressed genes (DEGs) in response to hypoxia induction through transcriptome sequencing. d KEGG enrichment of DEGs. Only KEGG terms with P < 0.05 are shown (Fisher’s Exact Test). e Expression pattern of DEGs involved in energy metabolism. Heat map signal indicates log2 fold-change values relative to the median expression level within the group. Yellow signal represents higher expression and blue represents lower expression relative to the median level within the group

