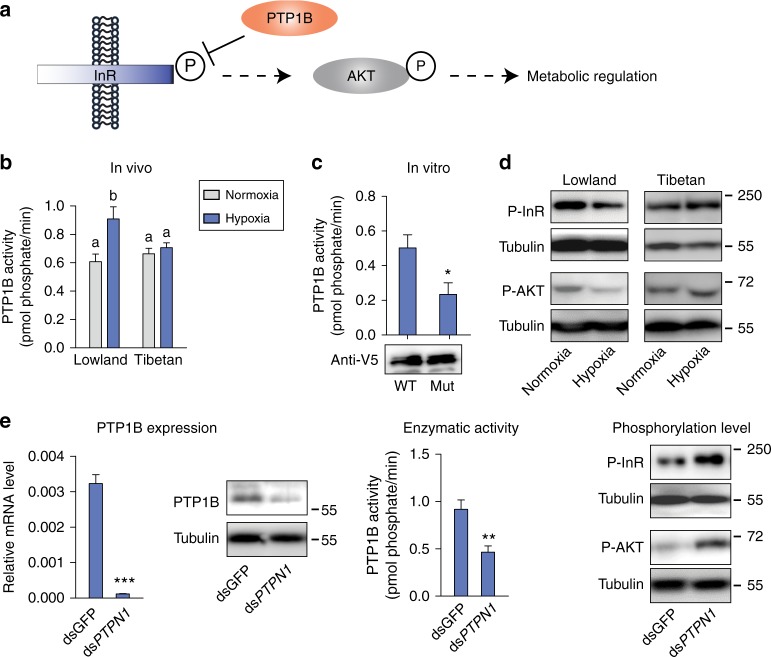
Fig. 4.
Effect of PTPN1 mutation on the insulin signaling pathway. a Illustration of the insulin signaling pathway, in which PTP1B is a negative regulator of the pathway through the dephosphorylation of insulin receptor at its tyrosine site. b PTP1B enzyme activity differing between Tibetan and lowland locusts in response to hypoxia induction. Significant differences are denoted by different letters (one-way ANOVA, P < 0.05) (n = 6 replicates). The values of the columns here and below are shown as mean ± standard error (s.e.m.). c The coding mutation altered PTP1B enzyme activity in vitro. The wild-type p.Asn349 (WT) and mutant-type p.Ile349 (Mut) PTP1B were overexpressed in S2 cells and induced by 1% hypoxia for 6 h. PTP1B production level was detected by western blot with anti-V5 tag antibody. *P < 0.05 by Student’s t -test. n = 3 replicates. Supplementary Fig. 15d shows the original image. d Western blot revealed decreased InR and AKT phosphorylation level after hypoxia induction in lowland locusts. P-InR and P-AKT represent phosphorylation of InR and AKT, respectively. The molecular weight markers are shown on the right side of the blot. Supplementary Figs. 15e–h show the original images. e PTP1B knockdown abolished PTP1B mRNA and protein level, repressed PTP1B activity, and increased InR and AKT phosphorylation level under hypoxic condition. The levels were examined 8 days after dsRNA injection. dsPTPN1 represents PTPN1 dsRNA knockdown. dsGFP was used as a negative control. PTP1B knockdown assay was performed with the lowland locusts. **P < 0.01, ***P < 0.001 by Student’s t test. n ≥ 3 replicates. Supplementary Figs. 15i–k show the original images

