FIGURE 5.

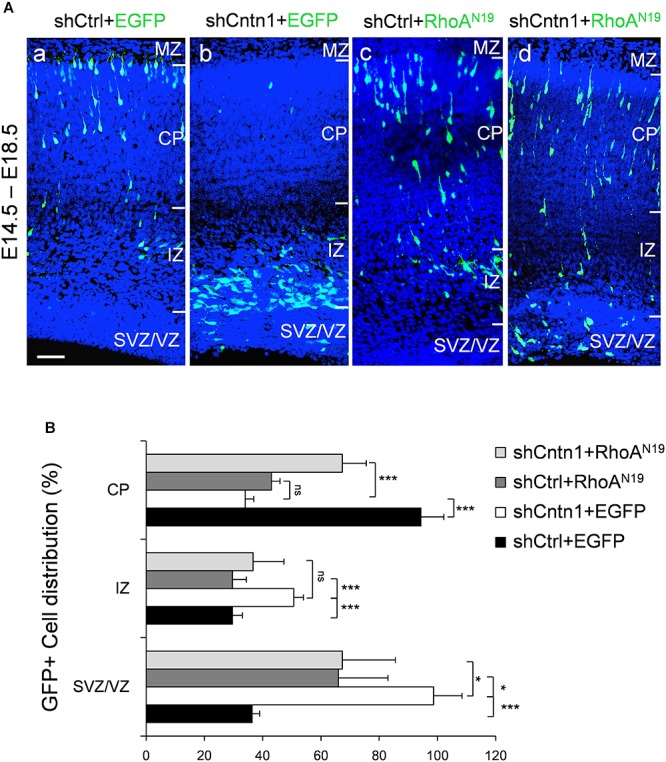
Expression of dominant-negative RhoA rescued migration defects resulting from Cntn1 KD. (A) Distribution of neurons in brain slices 4 days after co-electroporation of Cntn1 shRNA and dominant-negative RhoA (RhoAN19). (a) In the control brains electroporated with shCtrl along with EGFP (green), most cells have reached the CP. (b) Most cells expressing shCntn1 and EGFP are arrested in the IZ and SVZ, exhibiting a migration delay. (c) Expression of RhoAN19 alone showed some changes in cell distribution compared to the control brains in (a). (d) Co-electroporation of RhoAN19 along with shCntn1 reversed the migration defects observed in (b), producing cell distributions similar to those in control brains in (a). Blue: DAPI. Bar = 50 μm. (B) Bar graph of cell distribution in the brain 4 days after electroporation of shRNAs with or without RhoAN19. ns, not significant. ∗p < 0.05, ∗∗∗p < 0.001, one way ANOVA, Bonferroni post hoc correction. Data are shown as mean ± SD.
