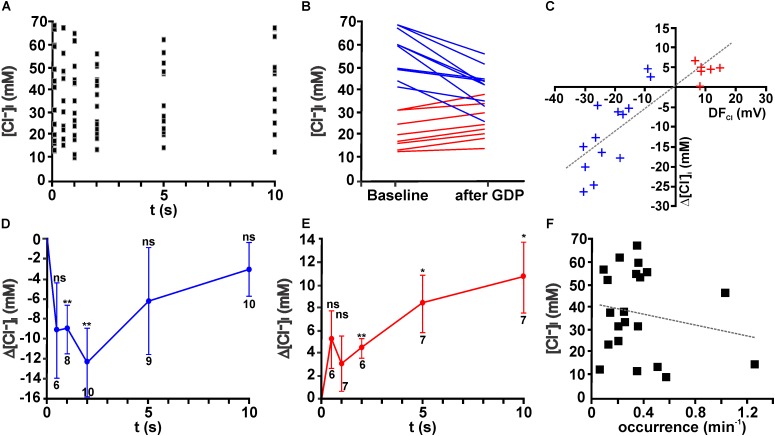
FIGURE 4.
Giant depolarizing potentials lead to substantial [Cl-]i changes. (A) Scatter plot of [Cl-]i determined at given intervals after a GDP in 19 neurons. Note that the [Cl-]i values tend to decrease between 1 and 5 s. (B) [Cl-]i of individual neurons at baseline conditions and 1–2 s after a GDP. Note the obvious alteration in [Cl-]i. Cells that respond with a [Cl-]i increase are represented by red lines and [Cl-]i decreases by blue lines. (C) Plot of the GDP induced [Cl-]i change (Δ[Cl-]i) against the estimated driving force (DFCl) for individual neurons. Blue symbols represent cells with a negative DFCl, red symbols cells with a positive DFCl. Note the obvious correlation between both values. (D) Average [Cl-]i changes observed at different intervals after GDP termination for all cells with a negative DFCl. In these neurons a significant [Cl-]i decrease occurs that peaked 2 s after GDP termination. (E) Average [Cl-]i changes observed at different intervals after GDP termination for all cells with a positive DFCl. In these neurons a significant [Cl-]i increase occurs. (F) Plot of [Cl-]i against the frequency of GDPs. No significant correlation between both values was detected. Data points in (D,E) represent mean ± SEM, numbers of experiments are given in the diagrams, ∗ indicates a p-level of <0.05 and ∗∗ indicates a p-level of <0.01.

