Figure 6.
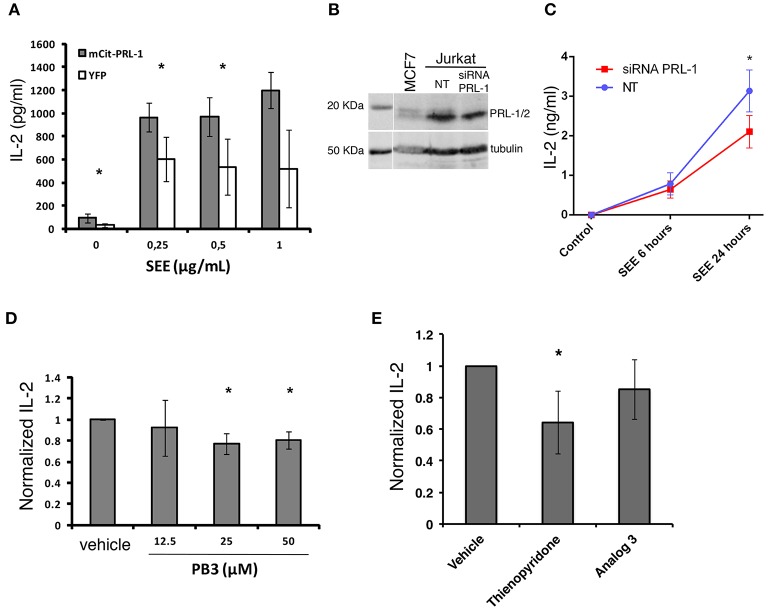
PRL-1 regulates IL-2 secretion. (A) IL-2 secretion assessed by ELISA in JK cells overexpressing either mCit-PRL-1 or YFP alone and stimulated for 16 h with Raji cells loaded with SEE. Samples in each SEE concentration were compared by a paired t-tests (n = 3 experiments). (B) PRL-1 and PRL-2 protein expression in JK cells transfected with a pool of siRNAs targeting PRL-1 or with a pool of non-targeting siRNAs (NT) as control. A lysate of the breast cancer derived cell line MCF7 was included in the WB experiment represented. (C) IL-2 secretion assessed by ELISA in JK cells transfected with the PRL-1 siRNA pool or the NT. The mean ± the SEM of n = 3 experiments is shown. Samples at different time points were compared by a t-test. The asterisks represent the p-value: *P ≤ 0.05. (D) IL-2 secretion assessed by ELISA in peripheral blood CD4 T cells treated or not with PB3 or the vehicle and stimulated for 6 h with antiCD3ε/CD28-coated beads. Concentrations of PB3 are indicated. Results were normalized to control (Vehicle) and the mean ± SD is shown of the data obtained with n = 4 experiments. Samples in each PB3 concentration were compared with the control (Vehicle) by a one-sample t-test of one tail. Asterisks represent the p-value: *P ≤ 0.05 (E) IL-2 secretion assessed by ELISA in peripheral blood CD4 T cells treated or not with the indicated inhibitor or the vehicle and stimulated for 6 h with anti-CD3ε/anti-CD28 coated beads. Results were normalized to control (Vehicle) and the mean ± SD is shown of the data obtained with n = 4 experiments. Samples were compared with the control (vehicle) by a one-sample t-test. Asterisks represent the p-value: *P ≤ 0.05.

