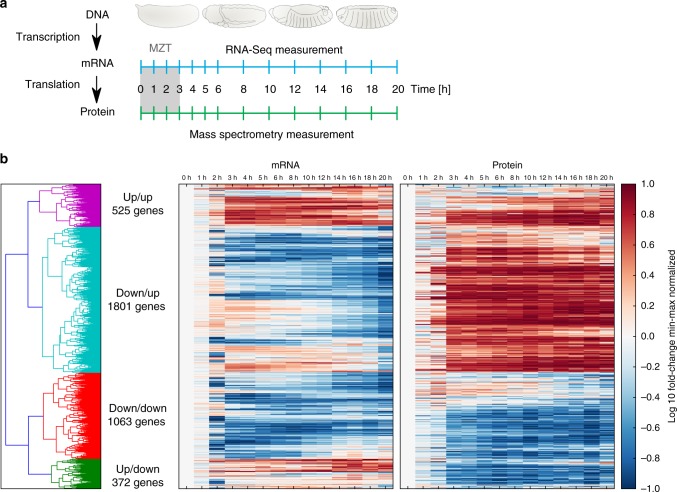
Fig. 1.
Paired transcriptome and proteome of Drosophila embryogenesis. a Time-points of paired mRNA and protein measurements during Drosophila embryonic development using RNA-Seq and mass spectrometry, respectively. The initial time point (0 h) represents egg deposition; the maternal-to-zygotic transition (MZT) occurs within the first 3 h of development. b Heatmaps of mRNA and protein time courses. The 3761 mRNA/protein pairs (y-axis), for which protein could be quantified in at least 10 of 14 time points, are shown for the developmental time points (x-axis). The color code indicates the mRNA and protein fold-changes relative to t = 0 h after min-max normalization between −1 and 1. Time courses are sorted according to hierarchical clustering using the Euclidean distance (see also dendrogram on the left). Time courses within each of the four clusters (green, red, blue, purple) roughly follow similar dynamics, reflecting concordant or opposing mRNA and protein dynamics (increase (up) or decrease (down))

