Fig. 3.
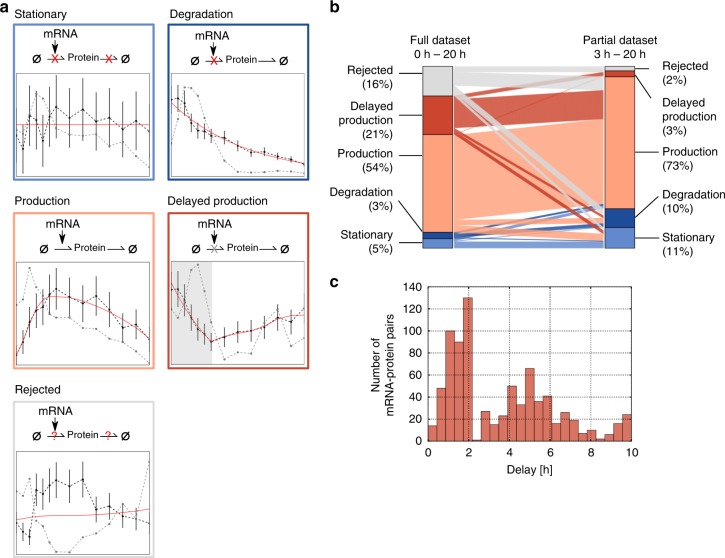
Kinetic models quantitatively relate mRNA and protein dynamics. a Schematic representation of model variants incorporating protein synthesis and degradation (thin arrows). Red and gray crosses indicate absence or delayed onset of individual reaction steps, respectively. The measured mRNA time courses were used as a model input, and simulated protein output was fitted to the corresponding experimental data by tuning the kinetic parameters. Each of the four different model variants was fitted separately and the best model was selected (see Methods). If all four models were rejected, the protein was classified as potentially post-transcriptionally regulated. An exemplary model fit for each class is given (red line), alongside with corresponding mRNA (gray) and protein (black) expression. Error bars represent standard deviation in protein according to the chosen linear error model. b Model-based classification results for 3761 mRNA−protein pairs. Barplot showing fractions of proteins in each class for the full dataset (left; 0−20 h) or post-MZT only (right; 3−20 h). Connecting lines indicate the migration of one protein from one model class to another between both scenarios. c Distribution of estimated delay times of 800 proteins assigned to the delay model in which protein translation occurs only with a lag time after egg deposition

