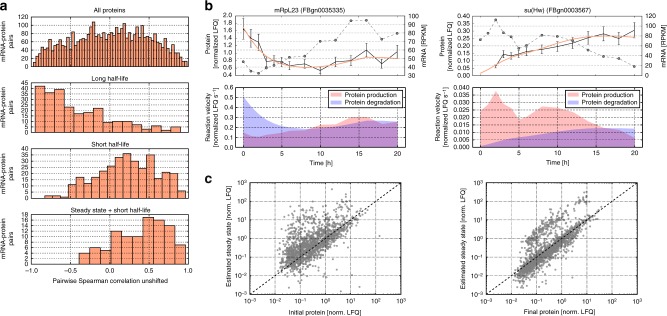
Fig. 4.
Kinetic models explain lack of mRNA−protein correlation. a The correlation of mRNA and protein time courses depends on protein dynamics and initial expression levels. Histograms for the distribution of Spearman correlations for all 3761 mRNA−protein pairs (top panel, n = 3761), proteins with long half-life (second panel, n = 260), proteins with short half-life (third panel, n = 331) and proteins with short half-life close to their estimated steady-state at the onset of embryogenesis (bottom panel, n = 101). See main text for details. b Examples of genes with inverse mRNA and protein dynamics. Left: For mRpL23 (FBgn0035335), mRNA level (dashed line) increased while protein levels (black line) decreased. Error bars represent standard deviation of protein according to the chosen linear error model. Model fit is shown as colored line. The lower panel shows the simulated velocities of protein production and degradation, which are initially unbalanced. Right: Conversely, for su(Hw) (FBgn0003567) the protein production velocity initially exceeds that of degradation, protein amount (black line) increased, while mRNA level decreases. c Protein levels early in development tend to deviate from the model-predicted protein steady-state. Measured protein levels for mRNA−proteins pairs classified into the production model (n = 2027) are plotted against estimated protein steady-states. Steady-state estimates were derived from the fitted model parameters as well as given mRNA concentrations at 0 h (left panel, Pearson correlation ρ = 0.61) and 20 h (right panel, Pearson correlation ρ = 0.79) using the equation α/λ * mRNA[t] (α: production rate; λ degradation rate and t time)

