FIGURE 6.

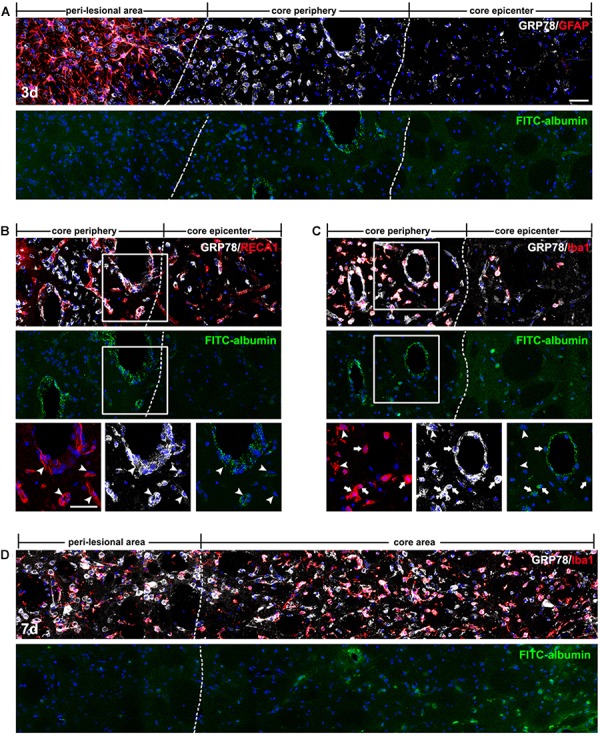
Spatiotemporal coincidence between vascular glucose-regulated protein (GRP78) expression and blood–brain barrier (BBB) leakage, as indicated by extravasation of fluorescein isothiocyanate (FITC)-albumin in the striata lesion by 3-nitropropionic acid injection. (A) Triple-labeling of FITC-albumin, GRP78, and GFAP 3 days after lesion induction, showing that vessels labeled with FITC-albumin are distributed only in the periphery of the lesion core, and not in the peri-lesional area or the lesion epicenter. The two broken lines indicate the borders of the three areas: the peri-lesional area, lesion periphery, and epicenter. (B) Triple-labeling of FITC-albumin, GRP78, and RECA1 at day 3, showing that both FITC-albumin and GRP78 are detectable in nearly identical vessels (arrowheads) in the lesion periphery. (C) Triple-labeling of FITC-albumin, GRP78, and Iba1 at day 3, showing that in addition to vascular walls, FITC-albumin is detected in amoeboid-like brain macrophages (arrows), but not in activated microglia with evident processes (arrowheads). (D) Triple-labeling of FITC-albumin, GRP78, and Iba1 at 7 days after lesion induction, showing that tracer extravasation is detectable throughout the lesion core (right side of the broken line). Cell nuclei are stained with 4′,6-diamidino-2-phenylindole. Scale bars represent 50 μm for A–D.
