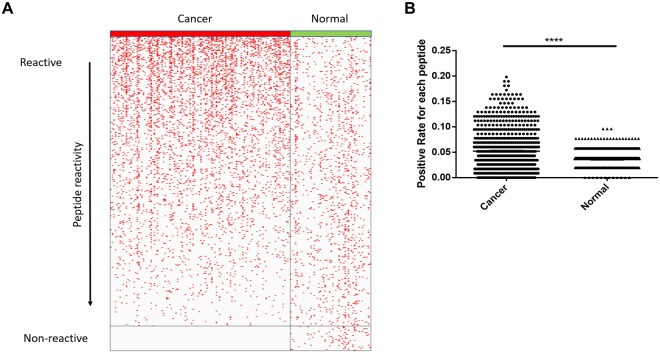
Figure 2.
Dog cancer serum samples had higher positive rate than normal samples. (A) Overall distribution of FSP positive samples in cancer group and normal group. Reactivity was sorted by descending order of cancer group, each red dot represented one positive sample for corresponding FS peptide. (B) Positive rate distribution of each FS peptide was compared between cancer group and normal group of all FSPs, p-value < 0.0001 with two-tail student’s t-test.

