Figure 3.
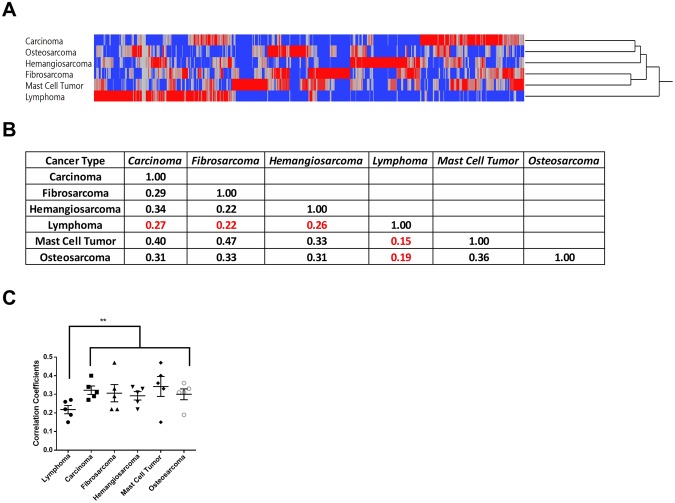
Positive rate distribution across different cancer types. (A) Two-way hierarchical clustering of positive rate of each FS peptide by each cancer type. Lymphoma was clustered to a unique group and the rest of the five cancer types as one group. (B) Correlation matrix of positive rates by each cancer group (carcinoma). (C) Correlation coefficients of each cancer type to the rest 5 cancer types, lymphoma had significant lower correlation coefficients (p-value < 0.01, student’s two tail t-test). Error bar represents standard error (Mean ± SEM).

