Figure 6.
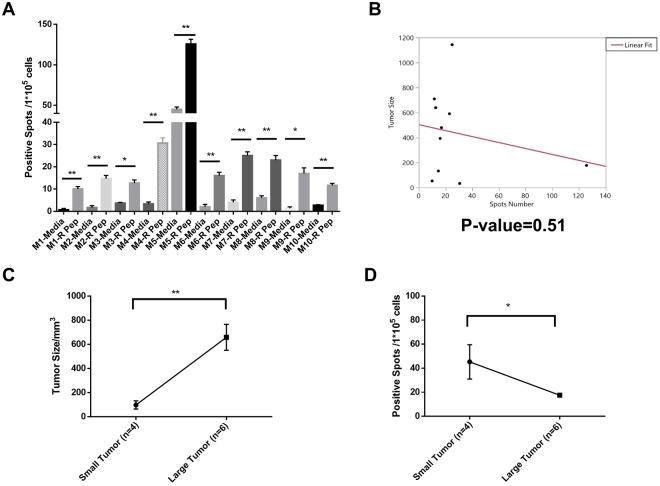
Reactive FSP induced T cell response and it was related to tumor protection in 4T1 breast cancer model. (A) IFN-γ Positive spots for media only and reactive FSP (R Pep) in 10 mice (M1-M10) of reactive FSP group. P-value < 0.01 with student’s two-tail t-test. (B) Tumor volume was linearly fitted against IFN-γ Positive Spots from ELISPOT experiments, p-value = 0.51. (C) 10 mice were separated into Small Tumor group (n = 4) and Large Tumor group (n = 6), p-value < 0.01 with student’s two-tail t-test. (D) Positive Spots from Small Tumor group were compared to Large Tumor group, p-value < 0.05 with student’s two-tail t-test. All error bars represent Mean ± SEM.

