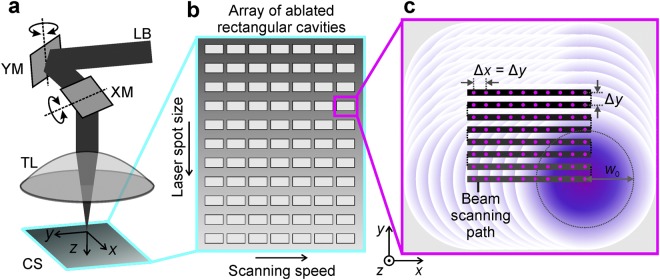
Figure 1.
Experimental setup and procedures. (a) Principal scheme of the experimental setup: LB - laser beam; XM and YM - x- and y-mirrors controlled by galvanometric motors; TL - telecentric f-theta lens; CS - copper sample; xyz - coordinate system. (b) Schematic representation of an array of laser scanned rectangular areas on the copper sample with variable processing parameters: the beam scanning speed and the laser spot size on the sample. (c) Schematic representation of the laser beam scanning path in each of the squares: black step-type line represents the path of the scanned laser beam on the sample; solid dots on the beam’s scanning path represents the centre positions of Gaussian laser pulses; overlapping circles show overlapped laser spots; Δx is the inter-pulse distance between laser spots equal to the ratio of the beam scanning speed and pulse repetition rate; Δy is the distance between two adjacent scanned lines; w0 is the laser spot radius on the sample.

