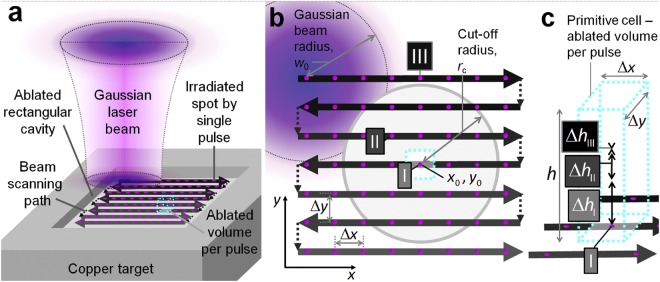
Figure 5.
Graphical representation of the laser ablation model. (a) 3D scheme of the laser ablation model of a rectangular cavity by parallel lines of the scanned laser beam. Solid circles represent the array of spots irradiated by single laser pulses. The black line with arrows represents the beam scanning path and its direction on the sample. The cube in the centre by a dashed cyan line represents the primitive cell - volume ablated by a single pulse. However, the depth of the ablated primitive cell is influenced by many surrounding pulses. The primitive cell has a volume equal to the volume of the whole rectangular cavity divided by the total number of pulses applied. (b) View from the top. The beam is scanned from left to right and from top to bottom leaving a quadratic array of spots irradiated by single laser pulses. Δx and Δy represent the lateral distances between adjacent laser pulses and scanned lines, respectively. The single laser pulse ablates the area marked by the cyan dashed line rectangle with the lateral dimensions of Δx · Δy in the position (x0, y0) marked by (I). Grey circle with the centre coordinates (x0, y0) represents the active ablation area with the cut-off radius rc. The non-zero ablation depth is achieved from the pulses within an active circle (II). All the laser pulses in position (III) outside the cut-off area have zero ablation depth because the laser fluence is below the ablation threshold in position (I). (c) 3D representation of the ablated volume per pulse. The maximum ablated depth in the active area from the central pulse (I) is given by hI. The non-zero ablated depth by pulse (II) in the active area is given by hII. The zero-ablation depth from pulses outside active (III) area is given by hIII.

