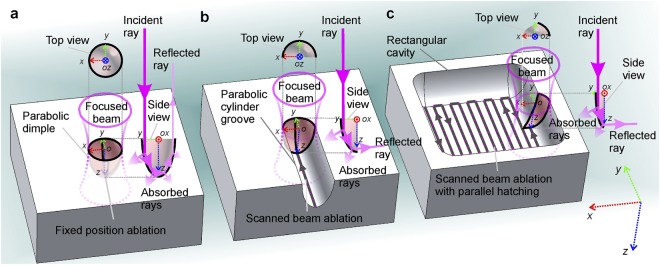
Figure 8.
Schematic illustration of the mechanism related to the saturation of the ablation depth in fixed position and beam scanning. (a) Dimple with the shape of a paraboloid of revolution ablated by multiple laser pulses with a fixed beam position. (b) Groove with the shape of a parabolic cylinder ablated by a scanned laser beam (line scan trajectory). (c) Rectangular shaped cavity ablated by a scanned laser beam and parallel line hatching (bidirectional snake scan trajectory). The 3D Cartesian coordinate system x, y, and z denoted by red, green, and blue doted arrows given in (c) (right bottom corner) is general for all images (a–c). The centre positions of the focused Gaussian beam pulses are indicated by letters o. The multiple reflections of incident ray from the interior walls are depicted in side views (yz planes). The absorption of incident ray and multiply-reflected rays are also depicted in side views (yz planes). The increasingly reduced interior wall area interacting with focused Gaussian beams are depicted in top views (xy planes) and side views (yz planes) as laser-mater interaction area decreases from (a) to (b) and from (b) to (c).

