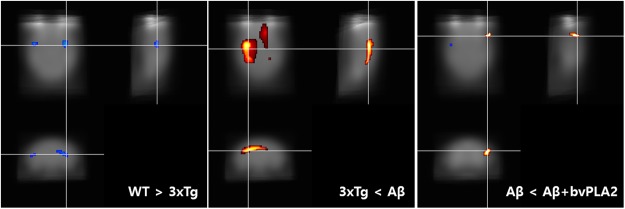
Figure 6.
Effect of bvPLA2 on glucose uptake in the brains of 3xTg-AD mice. Voxel-based morphometry revealed right-dominant asymmetry of cerebral glucose metabolism. The result of voxel-based statistical analysis was visualized [18F]-FDG scans comparing the WT and 3xTg groups, 3xTg and 3xTg/Aβ groups, and 3xTg/Aβ and 3xTg/Aβ + PLA2 groups. Red indicates a region of relatively high glucose metabolism in comparison to corresponding regions. Blue indicates a region of relatively low glucose metabolism in comparison to corresponding regions.

